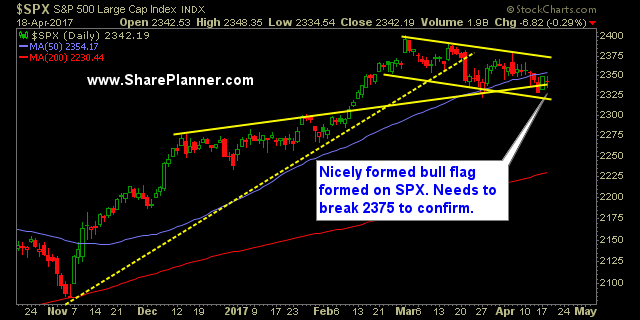
Watch resistance at the 50 day moving average
It had been acting as support prior to its break last week, but now the 50 day moving average has firmly converted itself into resistance overhead. Following the break last Tuesday, it has gotten close to pushing back above the 50 day moving average but each time it even gets close to the MA it has resulted in a sell-off, especially yesterday which showed strong potential to break through it prior to the afternoon meltdown.
This kind of market environment can be frustrating for traders, but the key is not to spend your entire day trading all over the place, thinking that will get the market to break through the resistance or sustain a rally.
Pick and choose what stocks you are going to trade during this time, careful with the entries. But above all else, don’t overtrade and don’t chase big moves in stocks. Find opportunities in stocks coming right out of consolidation.
And remember too, while the action in this market has been bearish in 9 out of the last 13 trading sessions, they have yet to really push this market lower. One big rally and you wipe out most of the month’s losses if not all of them, depending on the size of the rally. We are also trading inside of a massive bull flag that should price action breakout to the upside, should lead to a big expansion in price across all the indices (except the Russell of course, because the market loves to whip out the beating stick on the small caps).
S&P 500 Chart

Current Stock Trading Portfolio Balance:
Recent Stock Trade Notables:


Leave A Comment