
Crude Oil Weekly
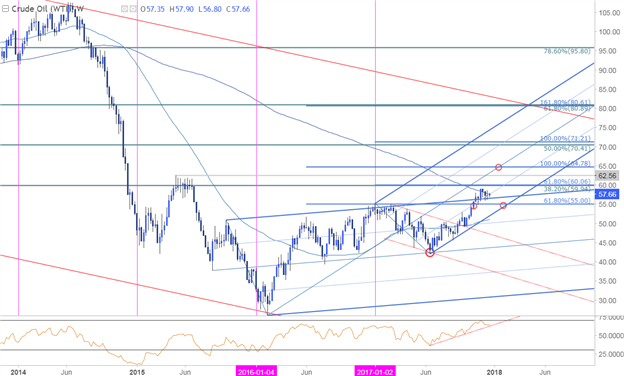
Technical Outlook: Crude prices rallied though the yearly range highs & confluence resistance at the 55-handle in late-October, shifting the broader focus higher heading into the close of the year. The advance is struggling a bit here with a near-term consolidation break to offer guidance over the next few days. Note that we’ve broken above the upper median-line parallel of the broad ascending pitchfork formation dating back to 2015- a weekly close above this threshold would be needed if this rally has still has legs.
Crude Oil Daily Chart
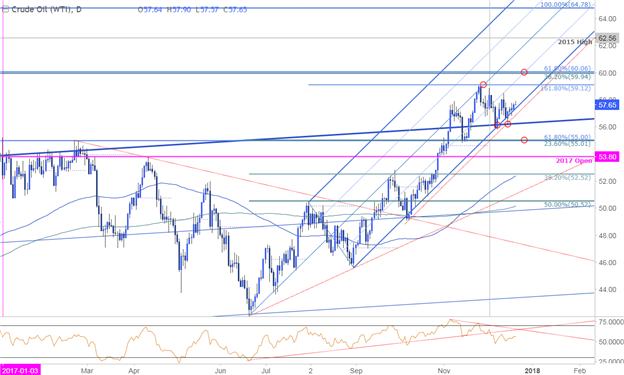
The daily chart highlights a near-term median-line formation extending off the yearly lows with price continuing to hold just above the lower parallel. Keep in mind that the December opening range remains intact between 55.79-59.02 – look for the break.
Crude Oil 240min Chart
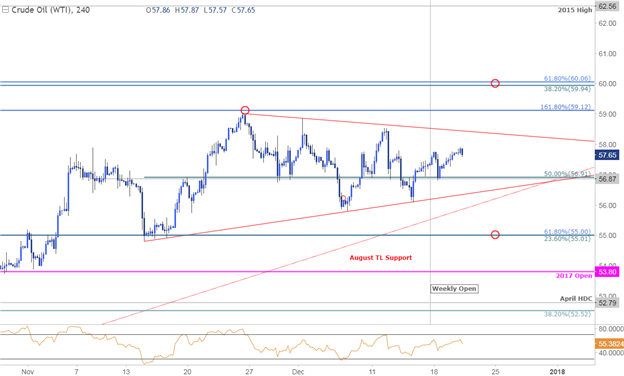
Notes: A closer look at price action sees crude prices continuing to consolidate into the apex of a multi-month triangle formation. A topside breach targets initial objectives at 59.12 with more significant resistance eyed at 59.94-60.06– a close above this region would be needed fuel the next leg higher in oil with such a scenario targeting the 2015 highs at 62.56 backed by measured consolidation target at 63.23.
A downside break would put us neutral on crude with a break below the 55-handle needed to put the bears back in control and would risk a drop towards the yearly open at 53.80 and 52.52/79 (levels of interest for exhaustion / long-entries IF reached). Bottom line: the immediate focus is on a break of this multi-month consolidation range. While a topside breach is favored, we’ll respect a break sub-55 with the decline likely to offer more favorable long-entries lower down in price.


Leave A Comment