
Video length: 00:10:07
Talking Points:
– Federal Reserve raises rates for first time since June 2006.
– Fed ‘dot plot’ continues to see same 2016 year-end rate as in September 2015.
– See the December forex seasonality report.
In what was perhaps the most telegraphed policy change of the past decade, the Federal Reserve raised rates for the first time since 2006. But it’s not what the Fed did with its current overnight rate that has everyone talking and markets moving: it’s what they didn’t do to their expected rate path for 2016.
Ultimately, despite downgrading its 2016 inflation forecast, the FOMC chose to maintain its expected glide path of its future policy rates (the median 2016 year-end rate was unchanged in the expected 1.25% to 1.50% range, or about four rate hikes).
Chart 1: Fed’s Dot Plot – December 2015
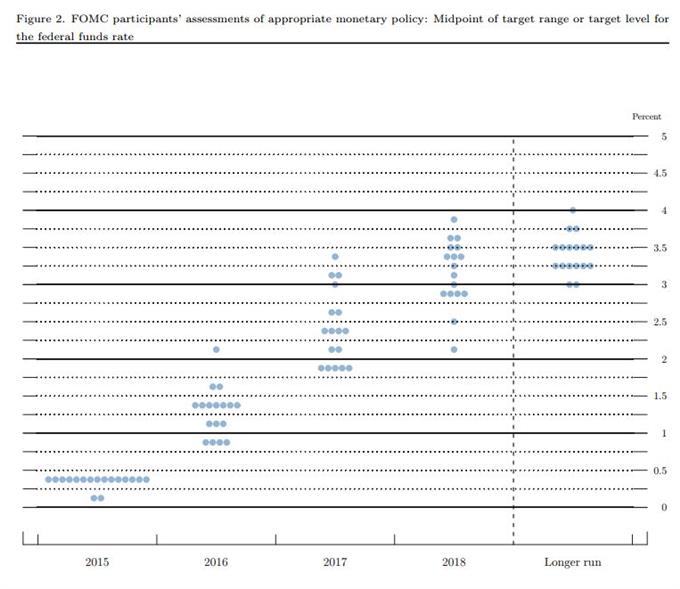
Ahead of the FOMC, it was widely anticipated that the Fed would reduce its expected glide path to have it fall closer in line with market expectations. But the Fed’s path of defiance instead is proving to be a veritable source of support for the US Dollar: markets are being forced to pull forward their rate hike timeline to match the Fed’s expected cadence.
Short-term yields are pushing higher, but more worrisome, long-term yields are falling and thus, the US yield curve is flattening. A flattening US yield curve portends to weaker economic growth, and should the yield curve invert, it would be an extremely worrisome sign: every recession in the post-war era has been preceded by the yield curve inverting.
Read more: December forex seasonality report
Lastly, as we approach the holidays and thus less liquid markets through the end of the year, it’s worth reviewing principles that help protect your capital. We call these principles the “Traits of Successful Traders.”

Related Posts
 Treasury Yields Tumble – Erase Post-Payrolls Spike
 Biotech Digest – JAZZ Reports Positive Results, CTSO Inks New Contract, AMGN Forges Collaboration
 Nigerian president-elect aims to use blockchain technology in the banking sector
- Baby DivHut Dividend Income Portfolio Update Q3 2017
 Wage Growth Momentum Is Still Strong
 U.S. Dividends Suggest Recessionary Conditions Rise In 2017-Q4


Leave A Comment