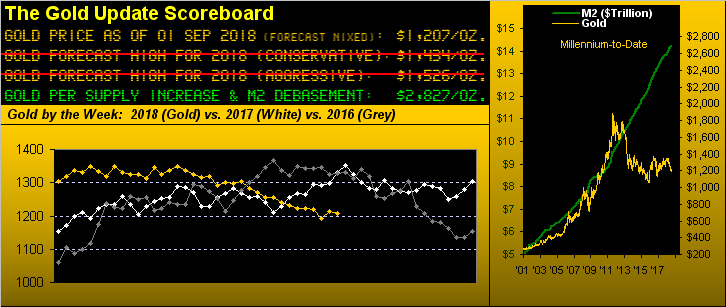
Two-thirds of the calendar year are gone. What else is gone? Gold. Gone down. Gone bad. Gone to hell in a hand basket. Gone to begging for handouts into said basket…as is Silver.
“She’s gone … oh I, oh I’d … better learn how to face it”–(Hall & Oates, 1973)
Back then in ’73, the “Gold Standard” had already been nixed by Nixon such that Gold settled the year at $106/oz. The U.S. national debt for 1973 was $458 billion. Today it is $21.5 trillion, (that’s 4,594% more national debt, “manufactured” out of nothing). Increase the $106/oz. price of Gold by the corresponding 4,594% values it today at $4,870/oz. Oh but wait, from the “Let’s Be Honest Dept.” Gold’s supply tonnage has since doubled. So let’s halve that: $4,870/oz. ÷ 2 = $2,534/oz. Or, by our Stateside Money Supply (M2) debasement method in the above Scoreboard, the value of $2,827/oz. is pretty much in that same neighborhood. We’d do a derivatives valuation as well, however our ever-trusty HP-12C (circa 1981) simply does not allow for the necessary number of decimal places. But as you voracious readers know, the “ought be” five-figure/oz. Gold Folks are out there.
Either way, curious how it’s trading at but $1,207/oz. by Friday’s settle. Indeed this past week marks the tenth one in the last five years that Gold has settled between 1200 and 1210. Much ventured, nothing gained. Much written, nothing changed.
“Are you actually capitulating?” Good gracious, no. “Marveling“ is more like it. And for month after month after month ad infinitum.
As for week after week after week of the parabolic Short trend spanning Gold’s weekly bars, price could not reach up even the mere 10 points it so needed this past week to halt the descending red dots. As below shown, taking out 1221 still remains the near-term hurdle to herald a return to ascending bluedots. Here’s the overall picture from a year ago-to-date, the rightmost third being nothing but down:


Leave A Comment