
Econintersect’s Economic Index improvement trend continues – and the index is now forecasting normal growth for the first time since early 2015. Six-month employment growth forecast indicates modest improvement in the rate of growth.
Analyst Summary of this Economic Forecast
The current data is being compared against relatively soft year-over-year historical data – and this is the primary reason that the index value is improving.
This month the internals of our index continue to be aligned in positive territory – all with positive contributions to Main Street.
Nothing in the special indicators would make someone conclude the Main Street economy will be changing much from what one sees today which is in conflict with our economic forecast.
Our 6-month employment forecast is forecasting improvement in the rate of employment growth.
This index is not designed to guess GDP – or the four horsemen used by the NBER to identify recessions (industrial production, business sales, employment and personal income). It is designed to look at the economy at the Main Street level.
The graph below plots GDP (which has a bias to the average – not median – sectors) against the Econintersect Economic Index.

This post will summarize the:
Special Indicators:
The consumer is still consuming. The ratio of spending to income has been elevated since Jan 2013. There have been only four periods in history where the ratio of spending to income has exceeded 0.92 (April 1987, the months surrounding the 2001 recession, from September 2004 to the beginning of the 2007 Great Recession, and for periods since late 2013 thru 2014). A high ratio of spending to income acts as a constraint to any major expansion in consumer spending. The current trend since the beginning of 2016 is the consumer spending a larger portion of their income – although the short term trend shows some deceleration (but has not broken the upward trend line).
Seasonally Adjusted Spending’s Ratio to Income (an increasing ratio means Consumer is spending more of Income)

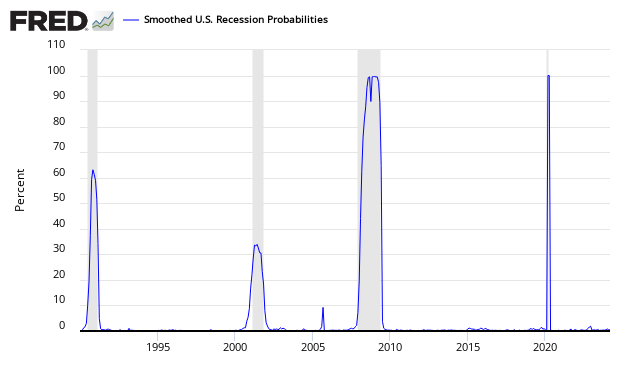
The St. Louis Fed produces a Smoothed U.S. Recession Probabilities Chart which is currently giving no indication of an oncoming recession.
Smoothed recession probabilities for the United States are obtained from a dynamic-factor markov-switching model applied to four monthly coincident variables: non-farm payroll employment, the index of industrial production, real personal income excluding transfer payments, and real manufacturing and trade sales. This model was originally developed in Chauvet, M., “An Economic Characterization of Business Cycle Dynamics with Factor Structure and Regime Switching,” International Economic Review, 1998, 39, 969-996. (http://faculty.ucr.edu/~chauvet/ier.pdf)
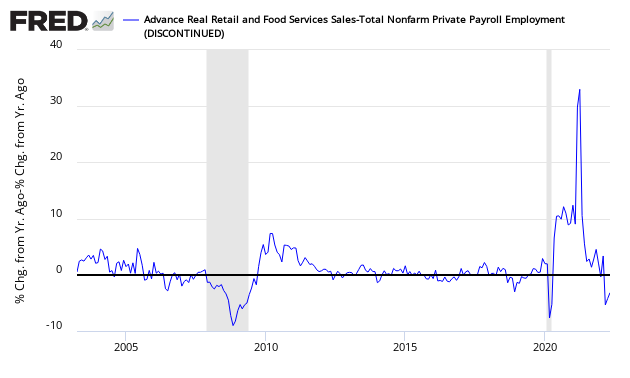
Econintersect reviews the relationship between the year-over-year growth rate of non-farm private employment and the year-over-year real growth rate of retail sales. This index is currently positive. When retail sales grow faster than the rate of employment gains (above zero on the below graph) – a recession is not imminent. However, this index has many false alarms – and is currently suggesting marginal economic growth.
Growth Relationship Between Retail Sales and Non-Farm Private Employment – Above zero suggests economic expansion
The growth rate of real gross domestic product (GDP) is the headline view of economic activity, but the official estimate is released with a delay. Atlanta’s Fed GDPNow forecasting model provides a “nowcast” of the official estimate prior to its release. Econintersect does not believe GDP is a good tool to view what is happening at Main Street level – but there are some correlations.

z forecast8.png or source
The New York Fed also has introduced its own economic projection called Nowcast. Its current forecast (which was terribly wrong forecasting 1Q2017 growth)
- Today’s advance estimate of GDP growth for 2017:Q1 from the Commerce Department was 0.7%, substantially weaker than the latest FRBNY Staff Nowcast of 2.7%.
- This week’s positive news from manufacturing and housing data pushed up the 2017:Q2 nowcast by 0.2 percentage point to 2.3%.

Related Posts
 US Will Overtake Russia To Become Top Oil Producer By 2023
 USDJPY Elliott Wave View: Turning Lower
- So What Happens Next? Global Risk Sentiment Could Be ‘Fragile’
- Sanofi (SNY) Q3 Earnings In Line, Sales Lag, Diabetes Weak
- Adidas enters the Metaverse with NFT partnerships
 Retail Apocalypse Accelerates: 200 Winn-Dixie Stores To Close As Parent Goes Bankrupt


Leave A Comment