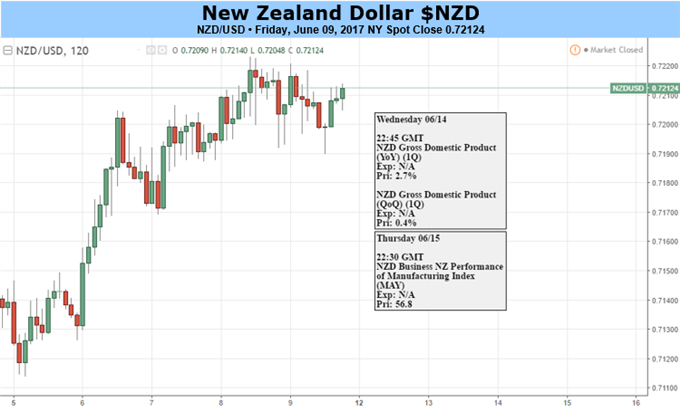
Talking Points:
Fundamental Forecast for NZD: Neutral
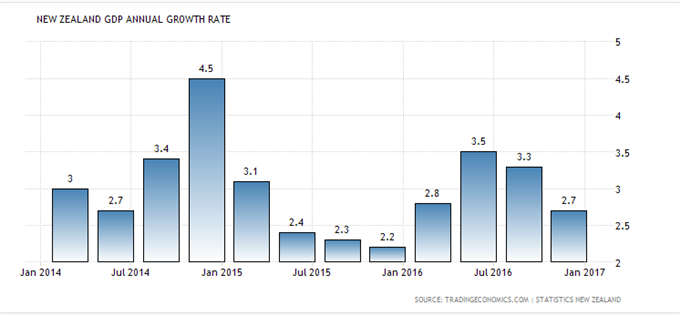
The month-long rally in NZD/USD may be coming to an end with notable data on the docket Wednesday, with the release of the latest GDP data. The release is expected to show year-on-year GDP growing by 2.9% in the first quarter, a reasonably clip but notably lower than Q2 and Q3 2016, driven by investment growth, a recovery in exports and migration inflows.
From a technical point of view, the recent breach of the weekly Fibonacci level at 0.71931 could see NZDUSD moving higher with the February high of 0.73759 the first target ahead of the November 2016 high of 0.74035.
CHART: NZDUSD Weekly Timeframe (December 2014 – June 2017)
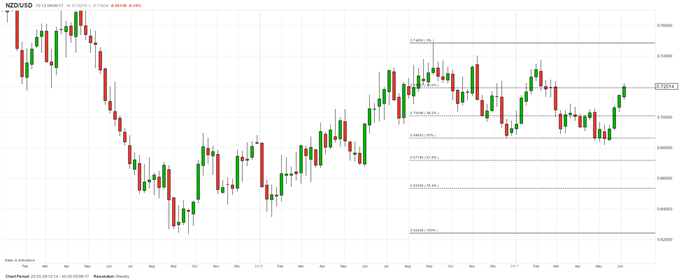
Chart by IG
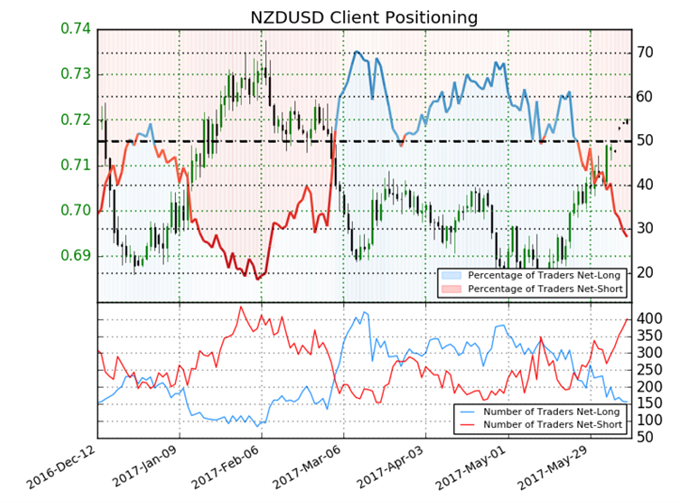
A look at the IG Client Sentiment Indicator also provides a bullish impulse for the pair. The latest data shows retail traders are net short of NZDUSD by a ratio of 2.55 to 1, setting up a bullish contrarian outlook.
The four-hour chart however points to exhaustion in the recent rally after the June 8 high of 0.72232, leaving the pair vulnerable to a downturn to the June 5 low of 0.71139.
CHART: NZDUSD Four-Hour Timeframe (May 18 – June 9, 2017)
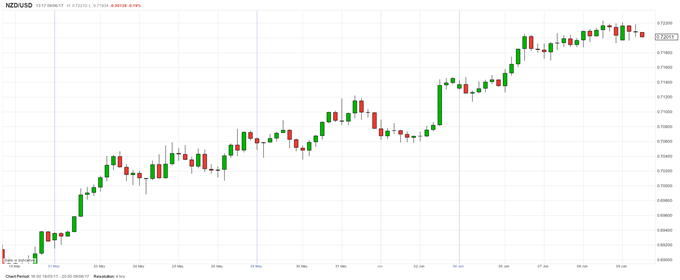
Chart by IG


Leave A Comment