
There is a lot of action going on this week in all the different areas of the markets. The PM complex has been rallying, the US dollar is tanking today and the stock markets have been trying to make up their mind which way they want to go in the short term. Here’s what I would like to see happen in regards to the HUI, gold and silver.
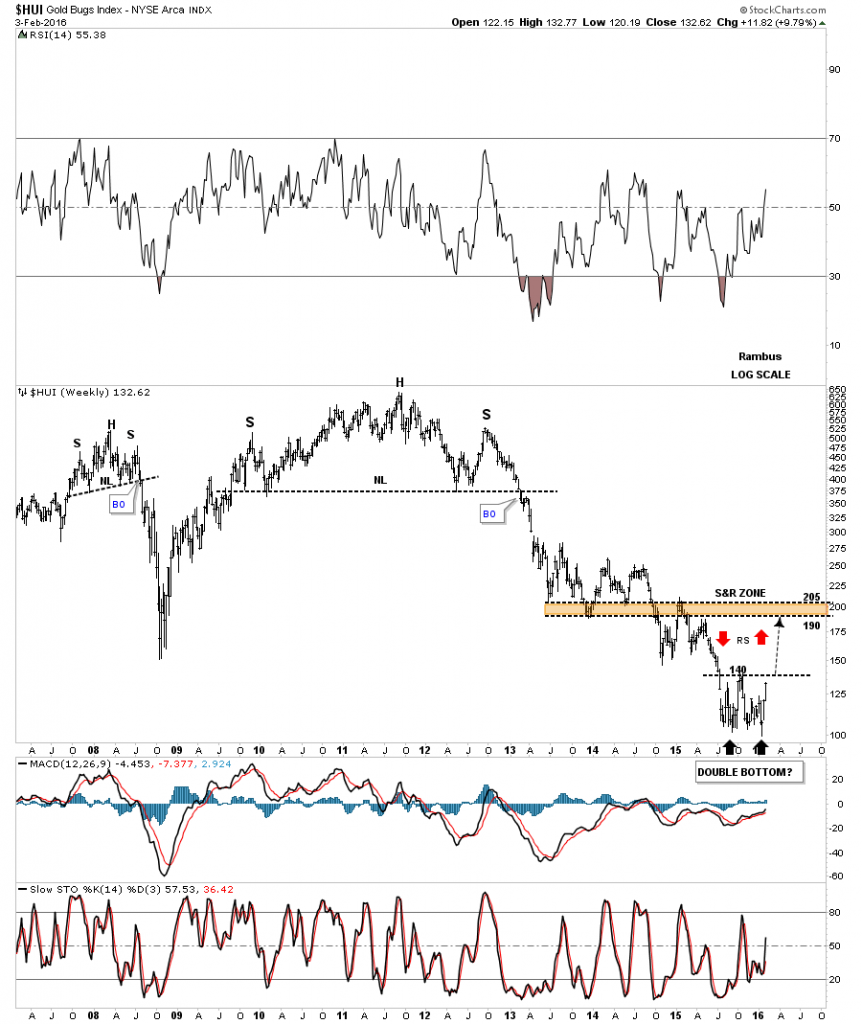
If the PM complex is bottoming here it has to show us its hand. There is no way around it. Usually when a bottom or top is formed the first move out of the reversal pattern, after a possible backtest, should be very strong or impulsive in nature. The bigger and stronger the move is, the better. Below is a weekly chart for the HUI with few annotations on it so you can see the clean picture. Most of the time you will either see some type of H&S reversal pattern or double top or bottom reversal pattern.
The best reversal pattern for the HUI at this point is the double bottom with the first bottom forming last August and the second one 2-1/2 weeks ago. If this possible double bottom is going to play out, I want to see the double bottom hump or double bottom trendline broken to the upside. Then after a possible backtest to the double bottom hump at 140 or so we need to see a strong impulse move up to the brown shaded support and resistance zone between 190 and 205. We may see some reverse symmetry as shown by the red arrows. If the HUI can make it up to the brown shaded S&R zone it will be due a breather and some type of consolidation pattern will build out. We should also see a fib retrace of 38%, 50% or 62% of the rally out of the second bottom at 100 or so. This would be the perfect setup.
Below is a weekly chart for gold which shows the price action out of the 2008 crash low. The top of that trading range came in around the 1030 area as shown by the brown shaded S&R zone. On the right hand side of the chart you can see the blue falling wedge, the pattern from hell, with the possible 7th reversal point forming just above the brown shaded S&R zone. With seven reversal points in play, and if gold can breakout above the top rail, then the almost three year falling wedge would be a reversal pattern to the upside. That big falling wedge reversal pattern should give gold a lot of energy to rally. So if gold is bottoming in here, then it has to show us the way by taking it one step at a time.


Leave A Comment