Do stock market correlations matter?
Statisticians use correlations (or cross-correlation) to measure the relationship between asset classes or investments. The general idea is to better understand the similarity or dissimilarity in how investments perform against each other and to build a portfolio of investments that can benefit.
The CBOE S&P 500 Implied Correlation Index (ChicagoOptions:^KCJ) also known as the “ICI” is one such statistical measure that uses options to estimate the average correlation among the largest 50 stocks inside the S&P 500 Index. The ICI recently hit 52-week lows indicating ultra low correlations between individual stocks and sectors.
Should investors use correlations between assets to make investment decisions? Before answering that question, let’s give a brief overview of how correlations work.
A correlation of +1.0 means that two investments have a perfect positive correlation. That simply means a correlation of +1.0 or close to it, is something you would expect from investments that perform and behave similarly.
Here’s an example: The historical performance and behavior of Intel (NasdaqGS:INTC) closely resembles the broader technology sector of stocks (NYSEARCA:XLK), which also happens to be Intel’s peer group. Should it be a surprise that Intel’s return pattern is similar to other technology stocks? Not at all, because individual stocks tend to behave similarly to the industry sectors where they reside.

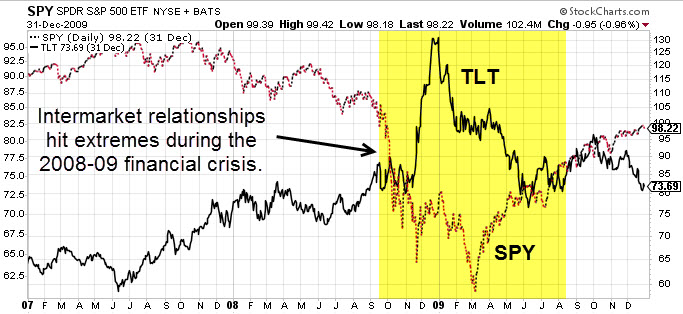
In contrast, a correlation of -1.0 describes two investments with a perfect negative correlation. This means the return path of the two investments move opposite one another.
Here’s an example: The relationship between the S&P 500 Index (NYSEARCA:SPY) and CBOE S&P 500 Volatility Index (ChicagoOptions: ^VIX) could be described as a nearly perfect negative correlation. Why? Because the historical movements of VIX (NYSEARCA:VXX) have been opposite the S&P 500 around 80% of the time.


Leave A Comment