
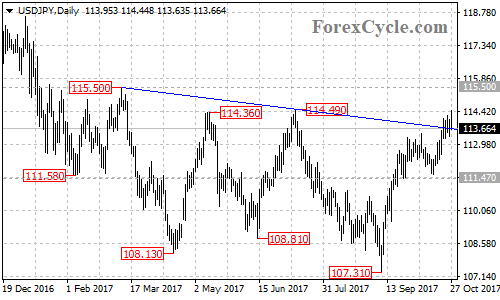
USD/JPY broke above the falling trend line from 115.50 to 114.49 on its daily chart. A further rise to test the 115.50 resistance could be expected after a minor consolidation.
Above this level will indicate that the downside movement from 118.66 (Dec 15, 2016 high) had completed at 107.31 already and the long term uptrend from 98.97 (Jun 24, 2016 low) has resumed.
Then next target would be at 118.66, the previous high. Key support is at 111.47. Only a breakdown below this level could signal completion of the uptrend from 107.31.


Leave A Comment