
In this series we scale-back and take a look at the broader technical picture to gain a bit more perspective on where we are in trend. Here are the key levels that matter heading into the open of February trade. Review this week’s Strategy Webinar for an in-depth breakdown of these setups and more.
DXY WEEKLY PRICE CHART
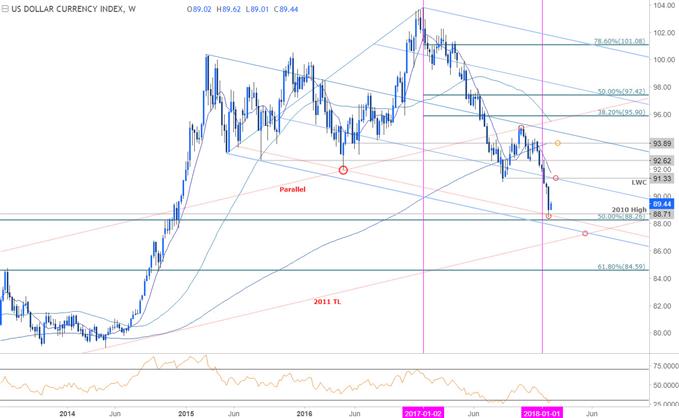
Notes: The dollar index is testing a key support range at 88.26/71 where the 2010 swing high converges on the 50% retracement of the 2011 advance. Note that basic downslope support also converges on this region and further highlights the near-term risk to the broader downtrend. That said, look for resistance back up at last year’s low-week close at 91.33 with a breach above 93.89 needed to shift the medium-term focus higher.
Bottom line: While our broader outlook remains weighted to the downside, price is now testing down-trend support and could limit further declines in the near-term. A break lower targets the 2011 trendline, currently around ~86.60s. Ultimately, from a trading standpoint, I’d be looking to fade a rally higher into the February open towards resistance.
USD/JPY WEEKLY PRICE CHART
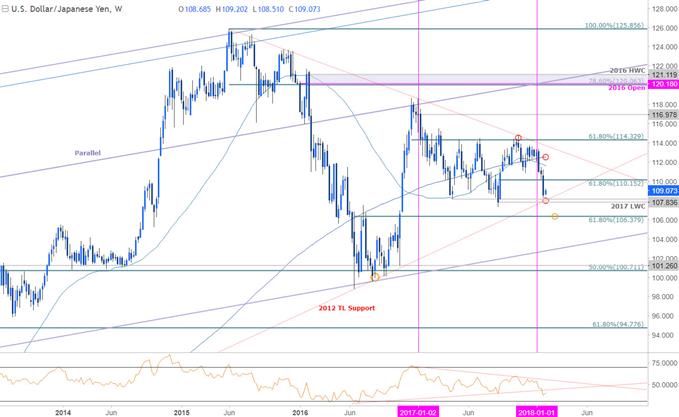
Notes: USD/JPY is approaching a technical support confluence at 107.45/84– a region defined by the April lows, the 2017 low-week close and basic trendline support extending off the late-2012 swing lows. The immediate short-bias is at risk near-term while above this threshold with interim resistance eyed at 110.16.
Bottom line:Although the broader outlook remains weighted to the downside, the decline could see a minor interruption heading into the close of the month. That said, a rebound would have us looking for short-entries while below the yearly open at 112.65 with a break below support eyeing subsequent targets at the 61.8% retracement at 106.38 backed by slope support near 102.80s.

Related Posts
 Gold Slammed For Second Day As ‘Someone’ Panic Dumps $3 Billion Notional Ahead Of London Fix
 E
The Euro Area Job Market Has Strengthened, But Unemployment Is Still Very High
E
The Euro Area Job Market Has Strengthened, But Unemployment Is Still Very High Fabrinet Shares Take A Beating Q4 Earnings Results
 Rick Rule: “Price Of Silver Will Explode”
 E
Market Briefing For Monday, June 5
E
Market Briefing For Monday, June 5 Pause For The Cause


Leave A Comment