
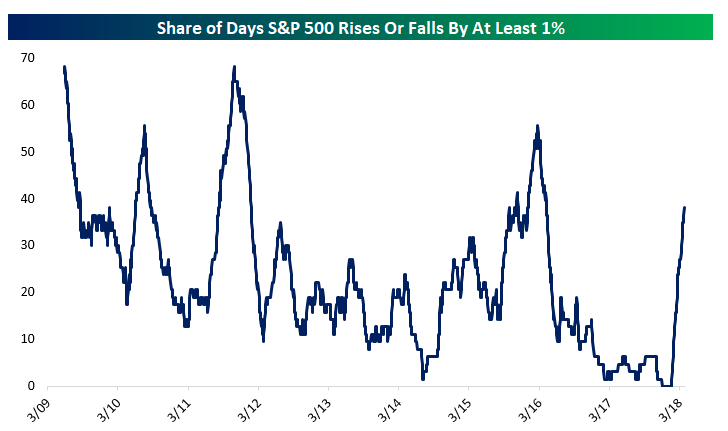
While the S&P 500 futures market occupied a relatively narrow range overnight, now that the US is trading there have been some more big swings intraday. After trading up at the open, stocks lost almost 1% through mid-morning lows. They then rallied more than 1.1% and have since pulled back again. That kind of intraday volatility is also met with closing price volatility. The VIX has been around 20 over the past few weeks, and we’ve been seeing a lot more 1% swings. In the chart below, we show the share of days where the S&P 500 either fell or rose by 1% over the past 3 months. From December 8th to January 25th, that rolling 3 month measure was zero…not a single 1% day! Over the last few months, though, the share of 1% days has rocketed higher. Currently, 38% of trading days over the past 3 months have been 1% moves. Only periods of volatility right at the start of the bull market, early 2010, mid 2011, and early 2016 saw higher shares of days with 1% or greater moves.


Leave A Comment