
The U.S. suffered another sizable gold supply deficit in 2015.Matter a fact, the deficit was 50% larger than in 2014.In 2015, total U.S.gold demand was 118 metric tons (mt) higher than total supply versus 77 mt in 2014.
According to figures put out by the USGS, World Gold Council and Thomson Reuters GFMS,the U.S. had a total of 553 mt of gold supply compared to 671 mt of total demand… leaving a 118 mt shortfall for 2015:
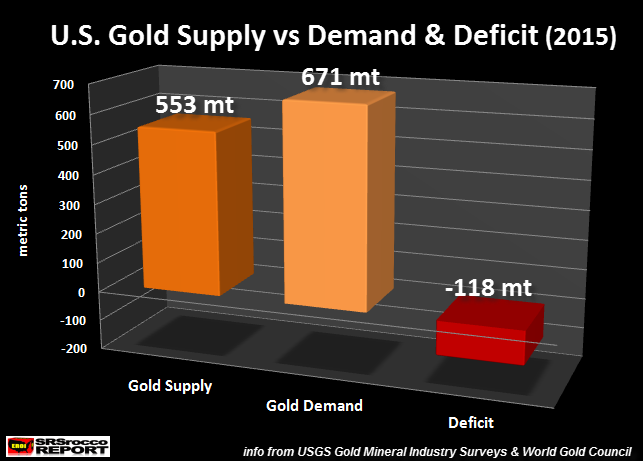
Here is how I arrived at the figures shown in the chart above:
U.S. Gold Supply & Demand Figures 2015
Domestic Mine Supply = 213 mt
Gold Imports = 265 mt
Estimated Scrap = 75 mt
Total Supply = 553 mt
Gold Exports = 478 mt
Domestic Consumption = 193 mt
Total Demand = 671 mt
Total Deficit = 118 mt
American gold consumption increased from 179 mt in 2014 to 193 mt in 2015.The majority of the increase was due to higher Gold Bar & Coin investment.According to the World Gold Council Full Year 2015 Report, Americans purchased 132 mt of Gold Jewelry and 47 mt of Bar & Coin in 2014 versus 120 mt of Gold Jewelry and 73 mt of Bar & Coin investment in 2015.
What was interesting was the huge spike of U.S. Gold Bar & Coin demand during the third quarter of 2015.This was at the same time when the retail silver market suffered extensive shortages with upwards of two month wait times on certain products. Americans purchased 33 mt of Gold Bar & Coin in Q3 2015, 45% of the total for the year.
While some precious metal investors do not trust any of the data that comes from the World Gold Council or Thomson Reuters GFMS, I believe the figures for the U.S. are pretty accurate.If we look at Gold Eagle sales from July-Sept 2015, they totaled 397,000 oz while Gold Buffalo sales were 74,000 oz. Thus, total sales of these two official gold coins equaled 471,000 oz or 14.6 metric tons.The remaining 18.4 mt of Gold & Bar & Coin for Q3 2015 was in from other official coins and bars (such as Gold Maples) and private bars and rounds.


Leave A Comment