
Before the year ends, I wanted to take a brief look back at the last six month, but more importantly, at the year ahead that awaits us. In my last market update, from June 23 of this year, we discussed the continuing bull market in SPX and how it was following nicely the 10 year crude oil analog. We forecast continued strength in SPX, as a period of sideways consolidation was likely to breakout to new highs before year end. SPX closed on 6/23 at 2438, and currently trades at 2675. Voila! The crude oil analog in practice.
So what awaits us in 2018? As you know, 2008 was a wild year for crude oil. The chart below shows the price of crude oil from 2007-2008. The first half of 2008, saw the final rising wedge formation for crude, followed by a powerful collapse during the second half of the year. My contention is that QE from the ECB/BOJ combined with other market forces is pulling this analog slightly ahead. I believe we currently find ourselves where the red arrow is showing below.
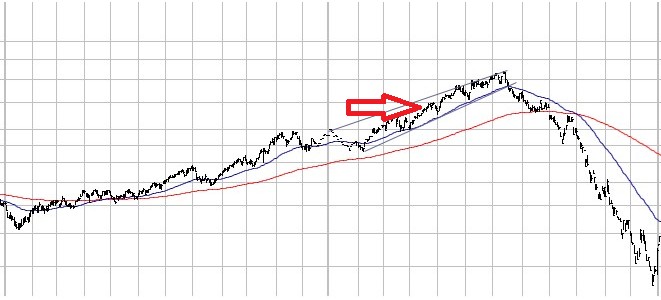
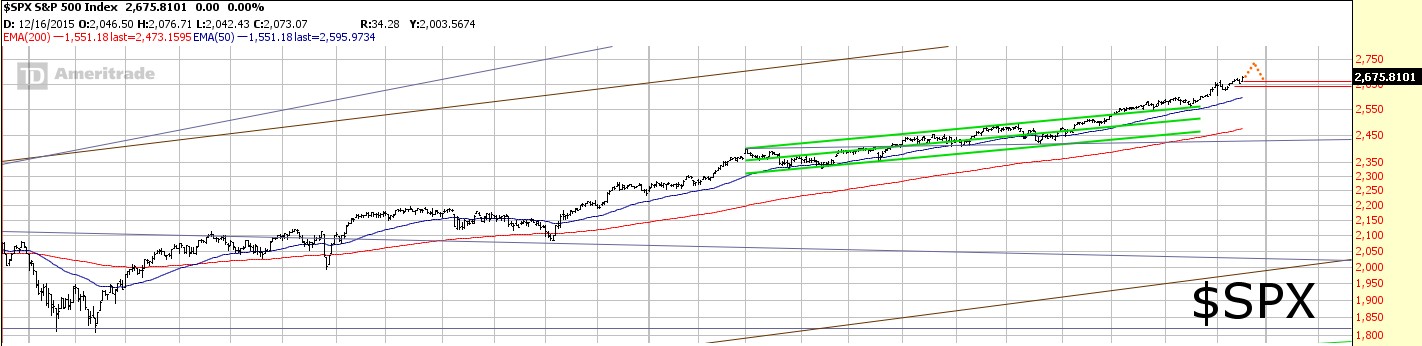
Evidence of this can be seen in the below chart of SPX. If you notice the multi-month sideways consolidation that happened in crude oil during the last two months of 2007,and the first two months of 2008.
The same consolidation happened in SPX this year, during the March-September time frame, but with a slightly up trending consolidation channel, instead of sideways. This can be an indication of market forces pulling the analog forward slightly. It can also be an indication that where the crude oil chart ended with a rising wedge, SPX in 2017-2018 may end with a parabolic rise.
As we enter 2018, the areas that I will be watching to determine when to switch from a bullish to bearish trading stance will be:
If you look at the final rising wedge in the crude oil chart, you will notice that it never breaks below the 50 day moving average until the bear market began. A similar scenario could play out with SPX in 2018, and will be one key indicator to watch.


Leave A Comment