
For the last five years, crude oil has been behaving a little differently than it has in the past. At least that’s the takeaway from the chart below, based on the Moore Research Center’s analysis of oil’s seasonal trading patterns. Note that the index on the left measures the greatest historical tendency for the asset to make a seasonal high (100) or low (0) at a given time.
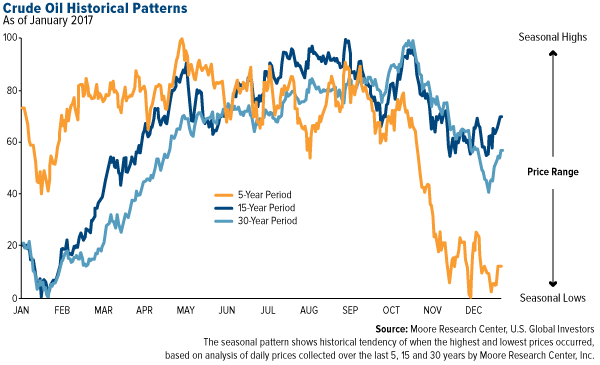
First, take a look at the dark and light blue lines, which represent the average price action for the 15-year period and 30-year period. In either case, oil looks remarkably the same—lows were most likely to have occurred in mid- to late winter, followed by a rally leading into the busy summer travel season. March historically yielded the highest monthly returns, October and November the lowest.
But then something changed. The five-year period, represented by the orange line, shows oil hitting lows not in the winter but in late fall. Highs were more likely in May, not September.
So why’s this happening?
Behold exhibit A, U.S. crude oil production since 1983:
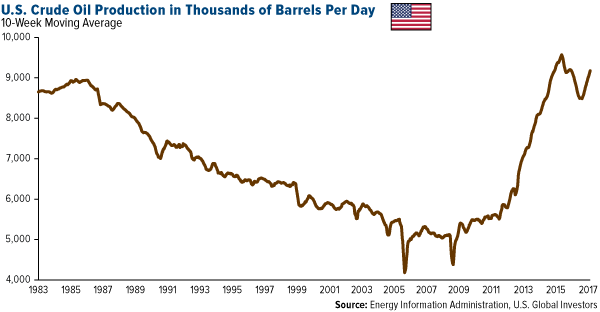
American Fracking Responsible for Record Output
Frankly, a lot has changed in the five-year period compared to the longer-term periods. We can put hydraulic fracturing, or fracking, at the top of the list, as it’s responsible for the huge ramp-up in production you see in the chart above.
Fracking has been among the most disruptive technological applications in the history of U.S. energy production. In 2009, oil producers were averaging a little over 5,300 barrels a day. Just six years later, they were well on their way to 10 million barrels a day before an oversupplied market kneecapped prices, prompting producers to shut down operations and abandon oilfields.

Now, with the number of active rigs in North America on the rise—for the week ended May 5, the number crossed above 700 for the first time in two years—production is beginning to mount once again. According to the Energy Information Administration (EIA), the domestic output should average 9.3 million barrels a day this year and nearly 10 million in 2018, a level we haven’t seen in this country since 1970.


Leave A Comment