 Image Source: UnsplashI didn’t feel right ending the day without another post, so I wanted to share this chart and say a couple of things about it.
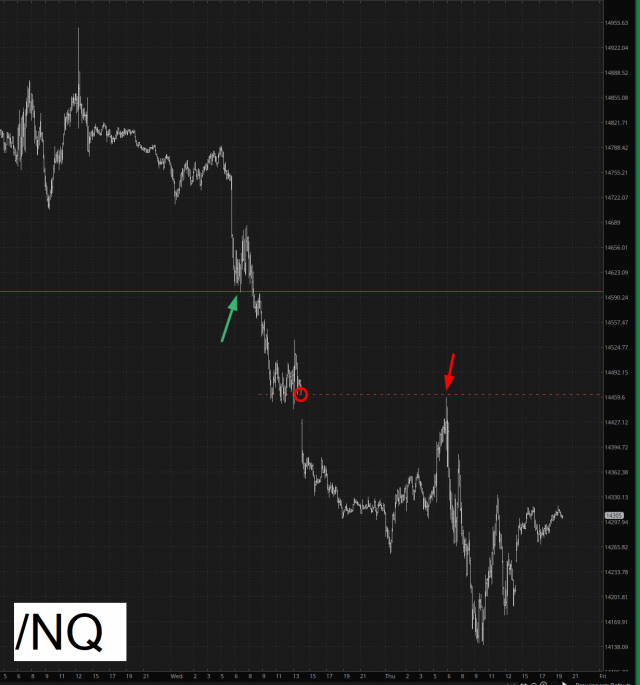 The above chart is of the NASDAQ futures over just about the last forty-eight hours..
The green arrow marks the last time the /NQ respected Fibonacci support. It hit this level to the penny, briefly bounced, and then the next time it approached it, BLAMMO, it broke right through and didn’t dare look back;
The red circle marks the price gap following earnings, and, incredibly, the arrow marks to price gap closure almost exactly to the penny. The chart-friendliness of this market continues to knock me off my feet!
I’ve got to level with you that I’m feeling oddly blue at this market. It’s been going great since early August (with lots of scares in the meantime), but when things are going really well, two nasty things happen to me psychologically which perhaps some of you share:
I get increasingly nervous that It’s Going to End, since it always does, and that’s a huge drag;
Because I’ve been preconditioned to deal with so many It’s Going to End terrors, I do NOT hang on to aggressive positions as long as I should, and again and again I am seeing 40% profits blossom into 200% profits, and I can’t stop kicking myself for them.
So – – yeah – – feeling kind of down. I’m going to sort hundreds of hanging file folders this evening, which will, weirdly, put me in better spirits.More By This Author:ETF Walkabout For Monday, Oct. 23
Redemption
Another Softbank Flop


Leave A Comment