
Is A Global Capex Boom Coming?
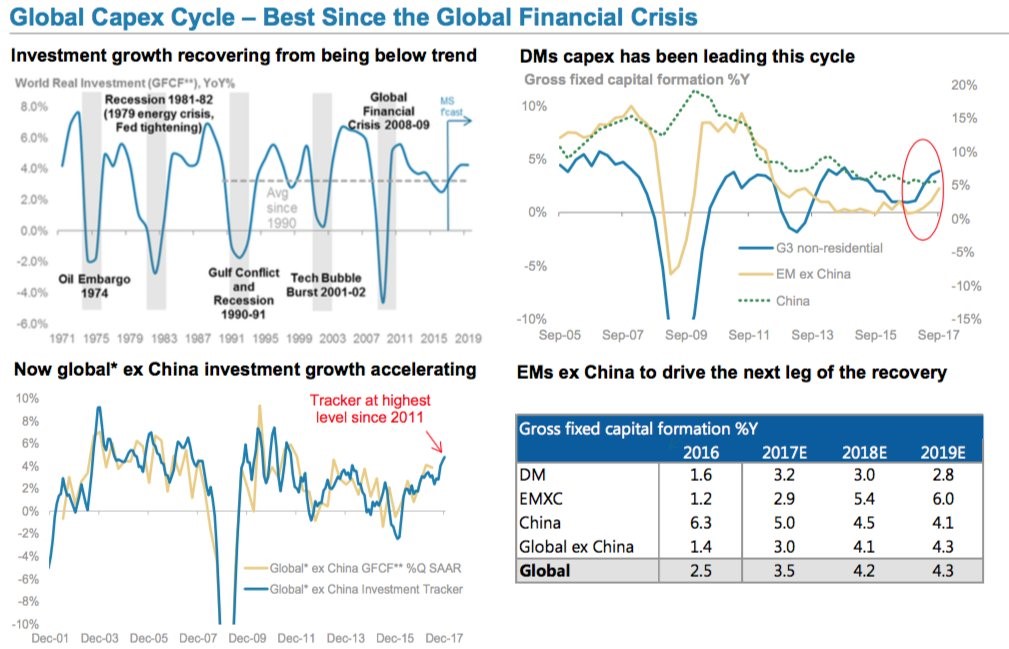
As you can see in the four charts below, the global capex cycle is about to increase. The first chart shows the historical global investment growth. After spending a few years below the average since 1990, Morgan Stanley is forecasting it to improve. The global economy appears to be emerging from a mid-cycle slowdown. Emerging markets rebounded in 2017 after a having a few bad years. They are looking to accelerate in 2018 especially India and Brazil.
The second chart on the right shows this breakdown I discussed. The emerging markets excluding China didn’t have much capex growth for about 3 years before accelerating last year. China’s capex growth is decelerating as its overall economy continues to see lower GDP growth; it appears 2017 was a temporary blip up for Chinese GDP growth. The G3 economies have led capex growth for the first time in at least 13 years. To be clear, the G3 countries are America, the EU, and Japan. They are mostly developed nations which have finally recovered from the financial crisis which is prompting hawkish policy from their central bankers.
The third chart on the left shows global fixed capital formation and an investment tracker which both exclude China which seems to be on a separate track downwards. The investment tracker is at the highest level since 2011 which signals fixed capital formation growth is about to pick up even more. The table on right shows the specific projections for each region. As you can see, China is slowing down, but the rest of the emerging markets are expected to pick up the slack. Global fixed capital formation growth is expected to be 4.1% in 2018 which is up from 3% in 2017.
Effect Of Fed Unwind & Deficits
I’ve discussed the unusual problem which faces the treasury market. The tax cut was passed at a terrible time because the economic cycle is almost over. It also increases deficits at a bad time because the Fed is unwinding its balance sheet. Treasuries might see the most selling pressure in years, pushing yields higher. The chart below shows the historical deficits combined with the changes in the Fed’s balance sheet. The stock market is being hurt by the 10 year bond yield going above 2.7%. If this policy goes through, the 10 year bond yield might go much higher. Furthermore, in the next recession, deficits will explode which might force the Fed to back up the debt with QE. As I mentioned previously, this balance sheet unwind will start to make Fed policy more hawkish than it appears. The Fed will be very hawkish next year which could cause a recession.


Leave A Comment