
This week the Dow Jones on Tuesday and Wednesday closed at all-time highs. That makes four new BEV Zeros in the BEV chart below in the past ten trading days, and that’s something I can’t complain about.

If you compare the four all-time highs of last January in the daily bar chart below, with the four we’ve seen since September 19, the advance of last January appears a little more enthusiastic. But after January 26th, it’s as if someone turned off a switch on the market’s advance; the Dow Jones began an eight month correction. Note the Dow Jones days of extreme volatility; 2% days / big daily bars. From February to early April the stock market saw seven of them, after which the stock market began its recovery.
The Dow Jones hasn’t seen any additional 2% days since April 5, which is good as days of extreme volatility in the Dow Jones are typically bearish market events. Still, we should consider the possibility that the current series of new all-time highs may not lead to large gains in the market in the weeks and months to come, but rather prove to be the beginnings of a historic double top in the Dow Jones.
One factor leading me to consider the current Dow Jones advance to new all-time highs to be a transient advance into record high territory is at the NYSE; we see a disturbing trend in 52Wk Lows developing in the table below. Over the past four trading days NYSE 52Wk Lows have spiked. So even if the Dow Jones itself is making new 52Wk Highs, an increasing number of shares trading at the NYSE are doing just the opposite.

As I’ve pointed out many times, our current advance began at the bottom of the credit crisis bear market on 09 March 2009 (Dow @ 6,547), nine and a half years ago. The Dow Jones has since advanced 20,281 points or 309%. That’s huge, but no advance goes on forever. As interest rates and bond yields have increased in the past two years, they’re approaching an unknown threshold that when crossed, will have a dramatic and negative effect on the stock market.
No one really knows what the market will do next; however at times like this anticipating what’s possible is good sport and entirely appropriate. Look at the market action on October 3rd and 4th in the NYSE 52Wk High & Low table above (Small Red Box). Thursday the Dow Jones closed down 0.75% from its all-time high of the day before with NYSE 52Wk Highs seeing their lowest levels in a month as 52Wk Lows soared to over 400. Come Friday much the same happened, with both days seeing a NYSE 52Wk H-L Net of more than -300. We haven’t seen a -300 NYSE 52Wk Net since last February.
It’s as if there’s a struggle between the Dow Jones and NYSE 52Wk Highs and Lows. Either the Dow Jones pulls those 52Wk Lows up, or the 52Wk Lows will drag the Dow Jones Down.
Next week could be interesting. If we see a -2% day for the Dow Jones with NYSE 52Wk Lows expanding to say 500 or more; that could be it for the 9.5 year Post Credit-Crisis Market Advance. But as always, keep in mind that today’s market values are managed, and it will be that way until the “policy makers” lose control over the market.
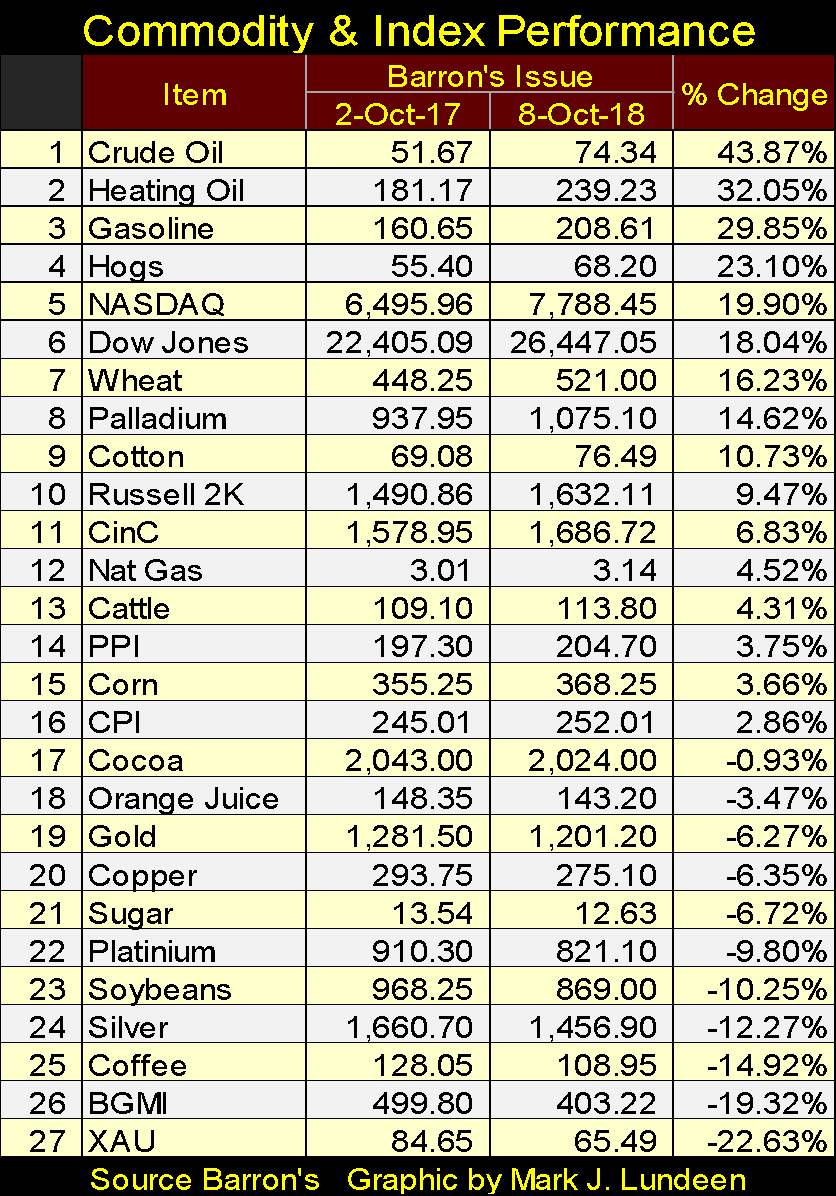
And how will we know when that happens? I expect we’ll then see the price of gold and silver break loose and roar upwards towards new all-time highs, not as they are now stuck at #19 & 24 in the table below. Look at the XAU at #27. This gold mining index began thirty-nine years ago in January 1979 at a base of 100. At the time the Dow Jones traded around 850. Today, four decades later the Dow Jones is trading over 26,000 as the XAU has declined to 84.65.
So what with that? The old saying that gold, silver and their miners benefit from inflation is all wrong. What benefits from monetary inflation flowing from the Federal Reserve System are financial asset and real estate valuations. The entire Federal Reserve System does everything possible to keep their flow of monetary inflation, and the general public’s investment funds as far away from precious metals assets as they can.
When the FOMC “injects liquidity” into the markets, it’s their euphemism that they’ve created billions of dollars from nothing to purchase bonds and mortgages in the open market to support debt prices and keep yields within “the parameters set by policy.”
This does wonders for the stock market too. After all, the FOMC stands for the Federal Reserve’s Open Market Committee. The only thing the FOMC does in the gold and silver markets is to flood their futures markets with tons of digital gold and silver, metal that doesn’t exist to crush any bullish sentiment that may have accumulated.


Leave A Comment