
 Image Source: Pixabay
In this week’s Dirty Dozen [CHART PACK] we go over the major sell signals triggered last week and discuss what this means for the market. We then talk about the current consensus and how that consensus is wrong, and we end with a look at a beaten-down Brazilian play, plus more…1. Well… we got the +90% Trend Fragility sell signal that we’ve been looking for this past week with the TF score ending Friday at 99%, its highest reading since Dec 2021.What this means is that forward returns over the next 1-3 months tend to be significantly worse than average. But… and this is important… it doesn’t mean we should go and completely flatten our books or start plunging short.There can be long lead times before a subsequent peak (ie, TF hit 100% on Dec 15th, 2017 but SPX didn’t peak until Jan 24th, 2018). The market is in a parabolic bull trend and parabolic trends tend to last longer than most expect. So what we’re doing is riding our longs but moving up and trailing tight stops for partial or full profits on our positions. This way we let the market reduce risk for us once it starts trading heavily and begins to turn. 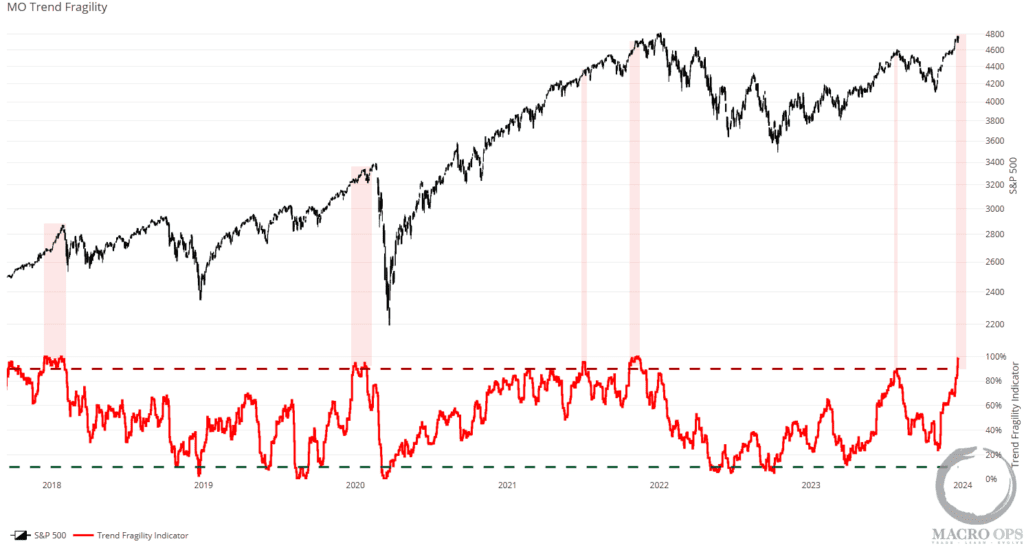 2. Here’s a look at some of our subcomponents of the TF index. This one is aggregate equity fund flows on a 3yr percentile basis. Notice that this one serves as both a good timing tool for both tops (marked in red) and bottoms (green). Currently, it’s 2% away from triggering a sell signal which I expect we’ll see this week.
 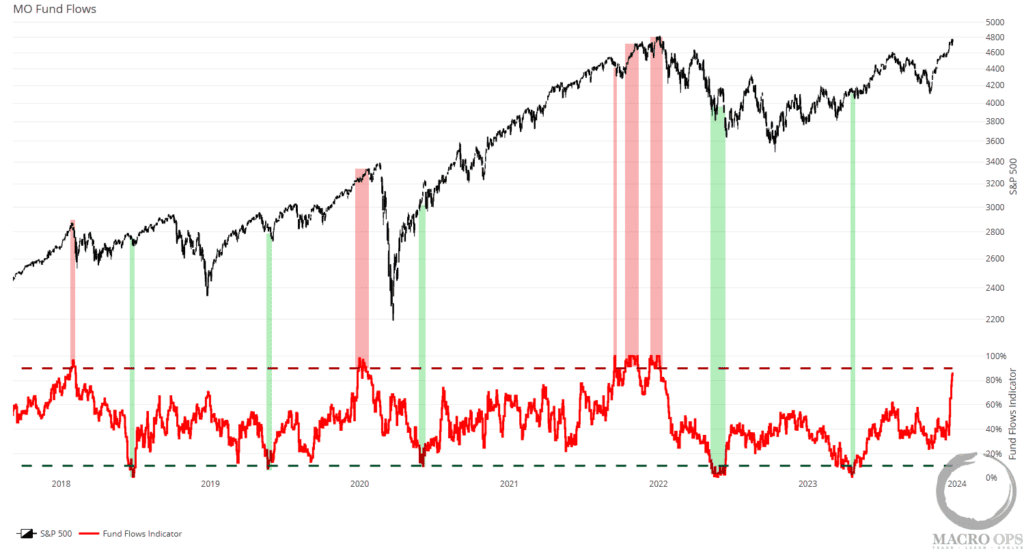 3. Aggregate Net Equity Index Large Specs climbed to 94% this past week, making it the highest reading since February 2020.
 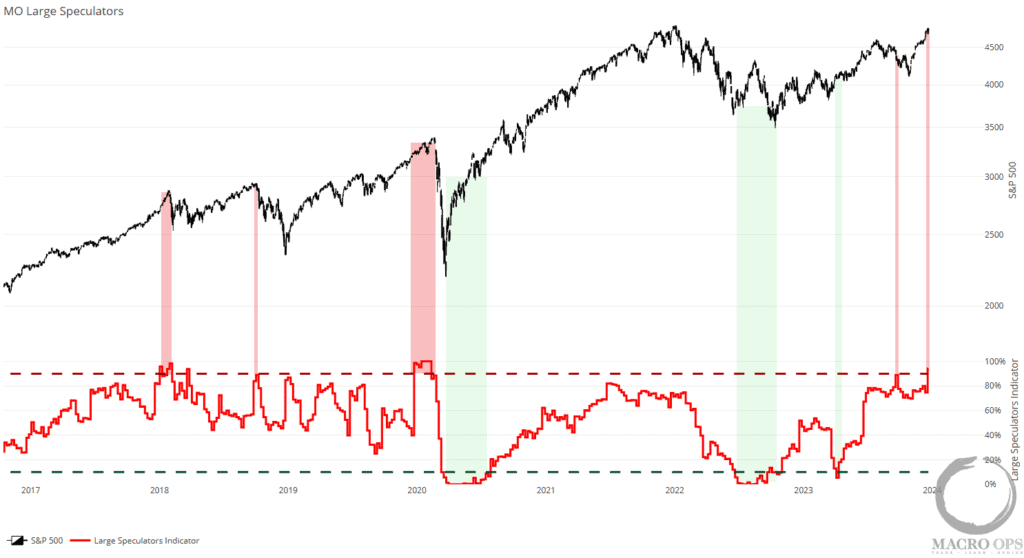 4. To help with the timing of the eventual turn and positioning/sentiment shakeout, we continue to track market internals which have finally begun to crack a bit. Below we can see credit (bottom left) and the VIX curve (bottom right) start to diverge lower from SPX.These are still early signs and not yet ominous by themselves, but worth keeping an eye on.
  5. And short-term breadth will also roll over before a top is put in. For now, breadth remains quite strong and supportive of the parabolic upmove.
 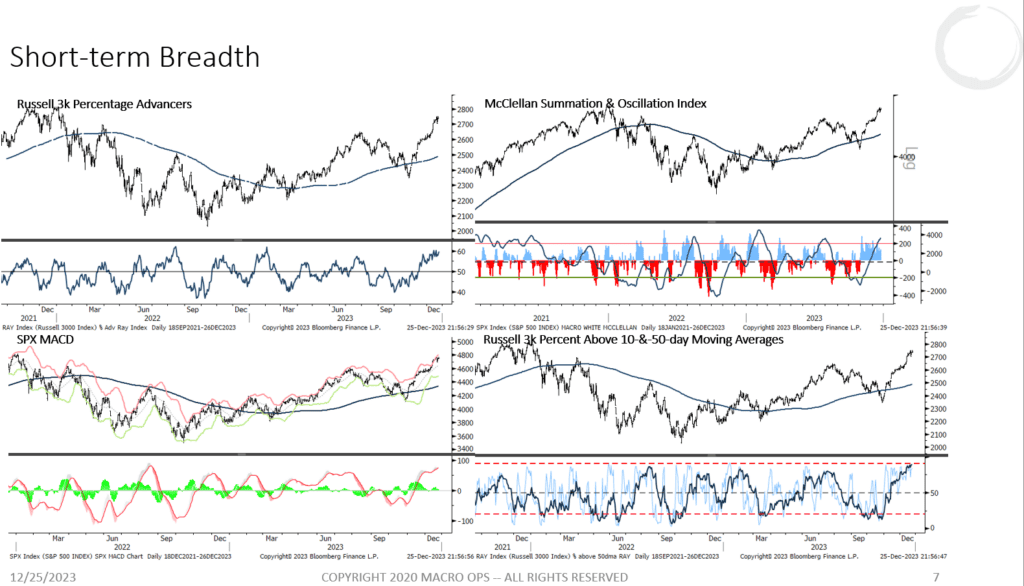 6. Here’s a daily chart of the SPX showing the upward trend channel it’s trading in. While the chart is certainly overextended in the short-term, the bulls remain in control of the tape, and the path of least resistance is up.
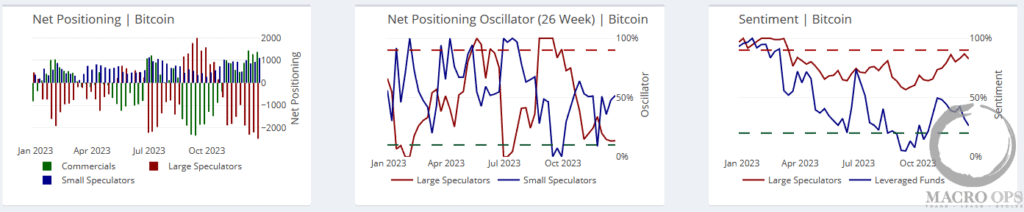
 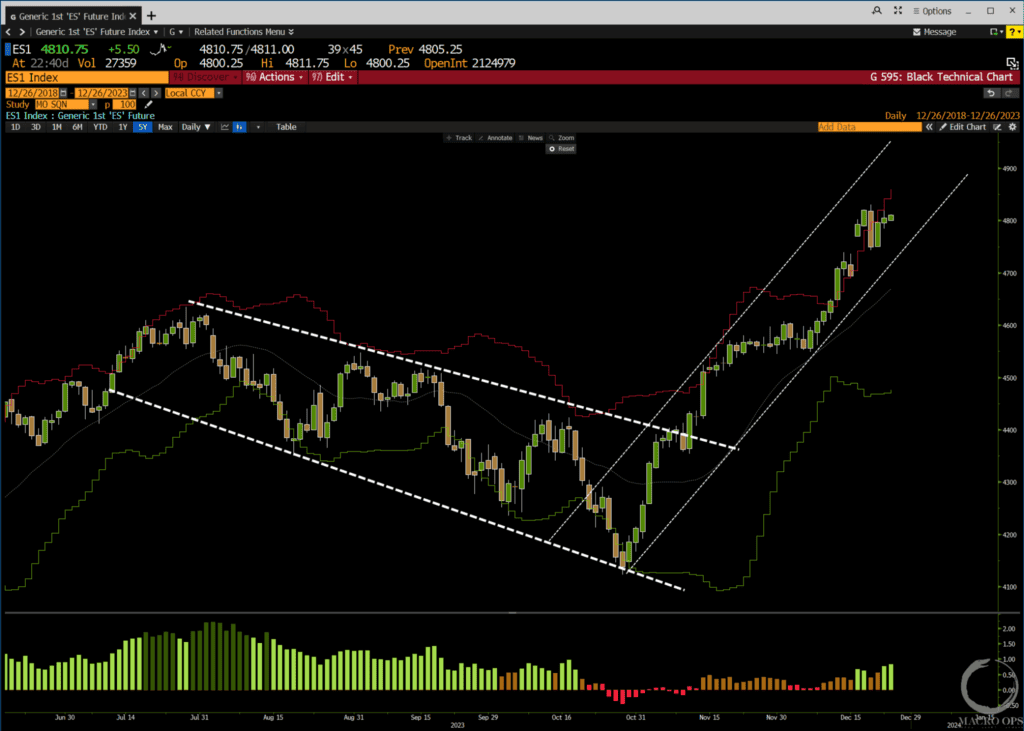 7. We’ve been long BTCUSD but have raised our stops as we’re playing this trend tight. With that said, we’ll look to add again to the position (with low risk) should we see a daily close above the current consolidation (top horizontal line).
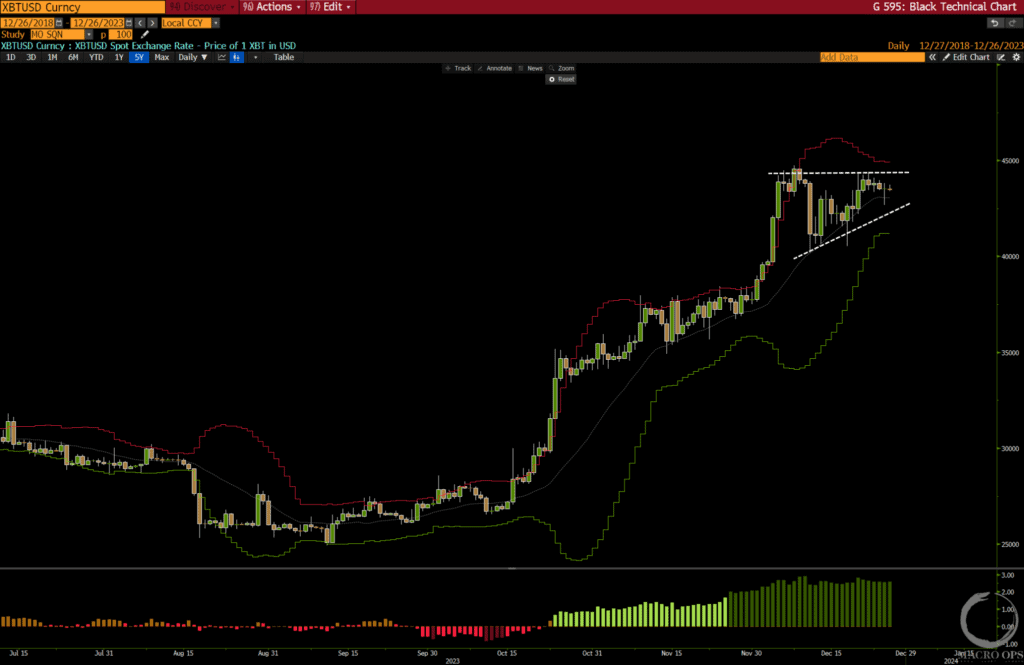
 8. Here’s a chart for all the bears who’ve been scratching their heads as to where this bullish impulse came from. It shows just how much financial conditions have eased over the past 6 months. The index charts the current Fed rate + 1yr change in FS FCI + cuts priced in for the next 12 months on a YoY basis (chart via BBG’s Simon White).
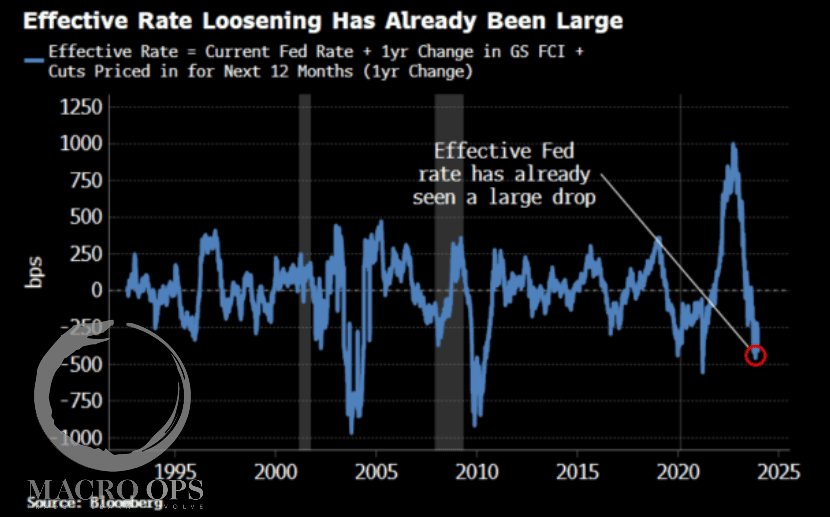 9. December’s BofA Global Fund Manager Survey had some interesting charts in it. The two below show that there’s a strong consensus that we’ll see a weaker economy and lower inflation next year.These views are backed by a 15-year positioning high in bonds and a 6-year low in allocations to commodities.
![]() 10. Here’s a sign that the consensus from these fund managers might turn out to be very wrong… Again, this one is from BBG’s White and the chart shows the Fed’s Wage Survey Indicator (pushed forward 6m) strongly inflecting higher and suggesting earnings will soon follow suit.
10. Here’s a sign that the consensus from these fund managers might turn out to be very wrong… Again, this one is from BBG’s White and the chart shows the Fed’s Wage Survey Indicator (pushed forward 6m) strongly inflecting higher and suggesting earnings will soon follow suit.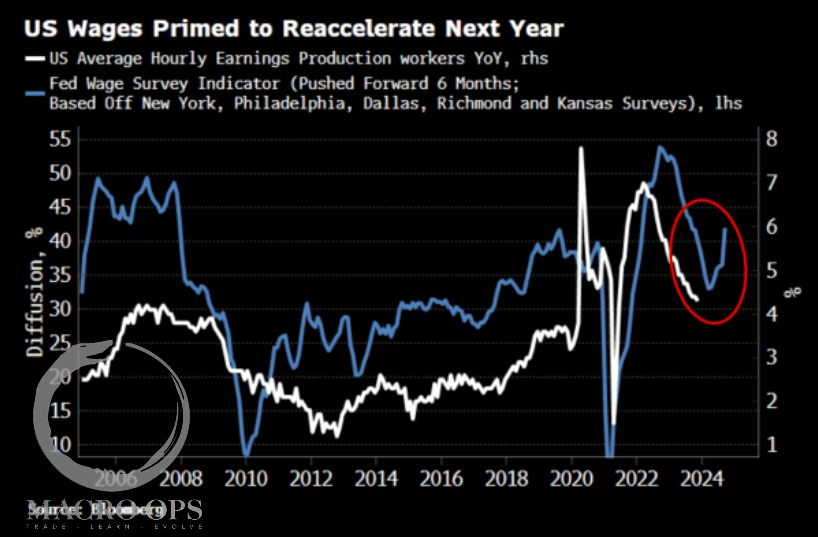 11. Brazil is cheap. Both on a relative and absolute basis. We’re digging into Brazil not just because they’re cheap and unloved right now but also because Brazil is the world’s largest net exporter of Agricultural commodities and we’re turning quite constructive on the Ag space.
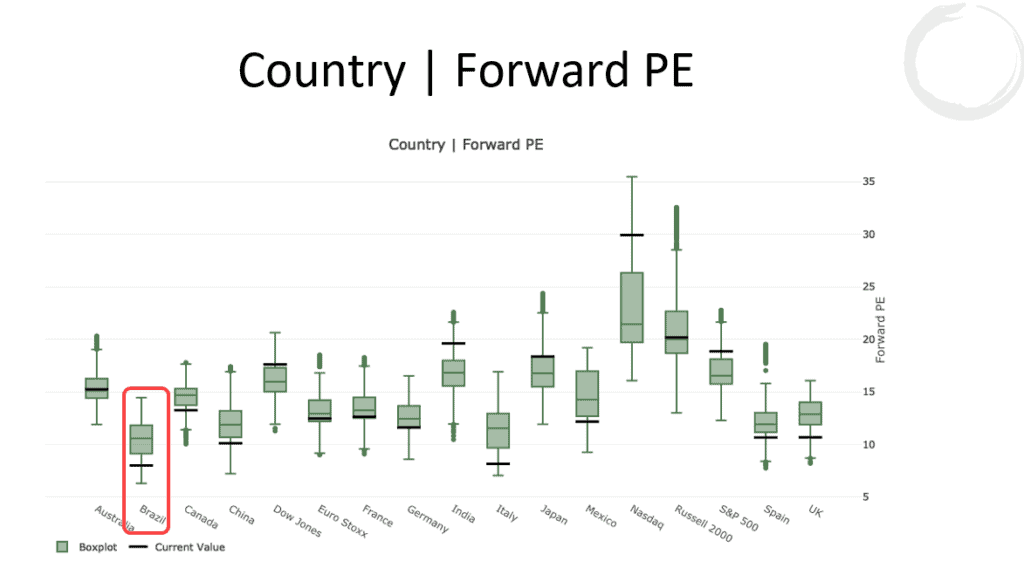 12. My preferred way to play this is to own the currency which looks primed to break out of a 3yr+ sideways range against the dollar. But we’re also starting to look at some of the equities in the space and one I plan on digging into this week is PagSeguro Digital Ltd., a São Paulo fintech company that’s been obliterated since its 2021 highs (currently off -80%+ from ATHs).I have no fundamental view of the company yet. I like the chart though. If you have a take on this one, please shoot me what you’ve got.
 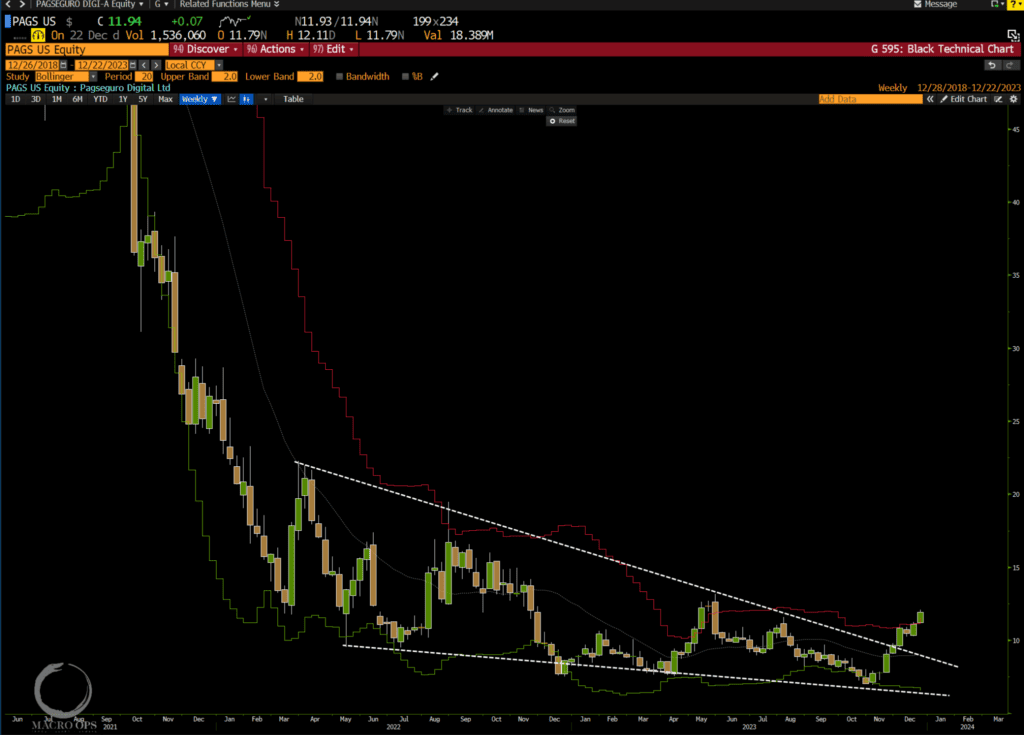 More By This Author:A New Bull Market In Smallcaps? A Big Breadth Thrust In FinancialsMarket Headed To New All-Time Highs?


Leave A Comment