There’s no reason to take substantial amounts of financial risk ever because you should always be able to find something where you can skew the risk-reward relationship so greatly in your favor that you can take a variety of small investments with great risk-reward opportunities that should give you minimum drawdown pain and maximum upside opportunities. ~ Paul Tudor Jones
In this week’s Dirty Dozen [CHART PACK] we compare overbought to underlying strength, and dive into the important context that helps one distinguish between the two. We then look at small-cap breadth thrusts, yield leads leading up, and a smallcap shipping company ready to run, plus more…
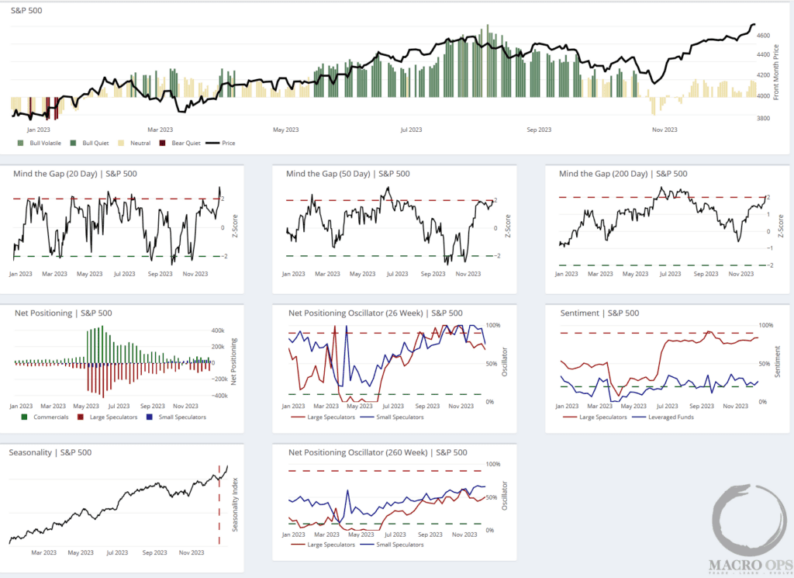
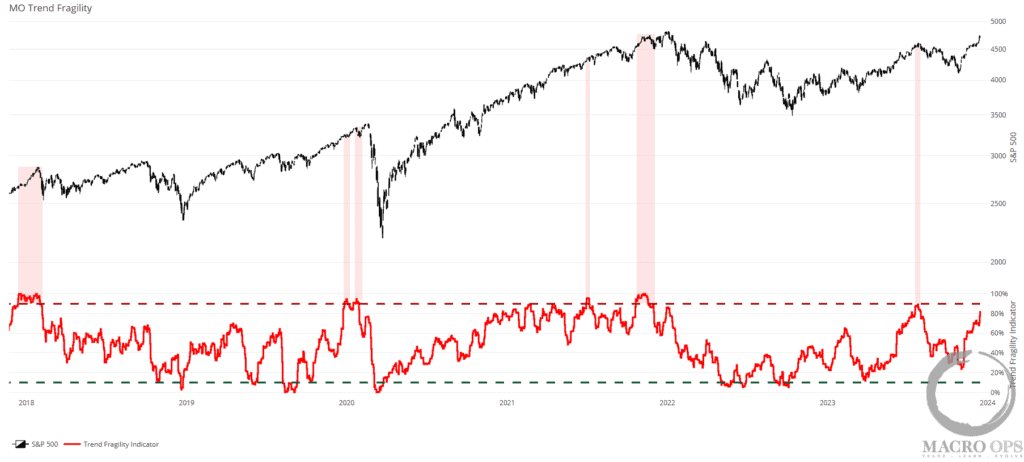
1. The SPX is in a neutral/blended bull market regime. It’s put in seven consecutive bull weeks, which is a rare show of strength. Our Trend Fragility score (a composite of positioning and sentiment) has jumped from its 24% lows back at the start of November up to 83% today, a sign of bubbling optimism, though still 7% shy of triggering a proper sell signal.This week it enters one of its strongest periods of seasonality though the tape sits at 2std+ overbought extremes across multiple measures.
2. The orange line is an aggregation of the percentage of SPX members trading above their 10, 20, 50, and 200-day moving averages. Extreme readings can indicate both overbought/sold and show the relative strength/weakness of the impulse underlying the trend.At the moment, 87% of SPX members are trading above all four moving averages, which is historically quite strong (yellow circles mark prior instances).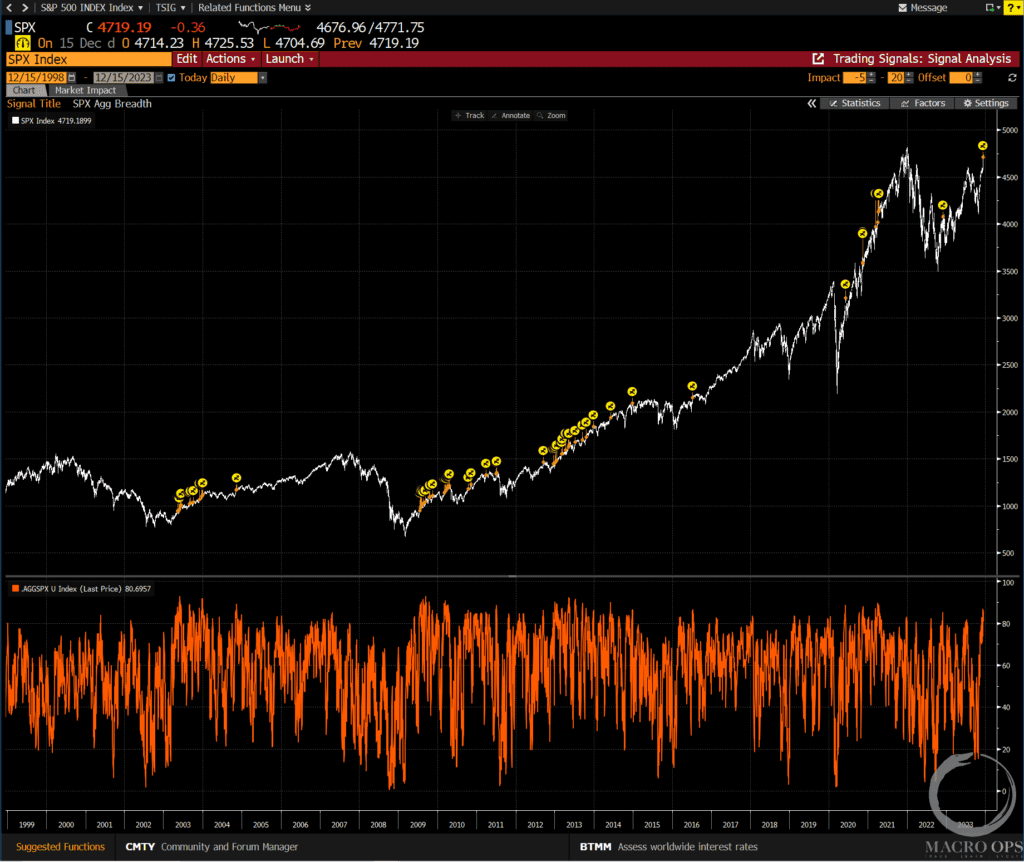
3. Over the past 20 years, there have been 62 above 85%. 46 of these went on to show positive returns over the following 40 days with a mean return of 3.9% (yellow line = average).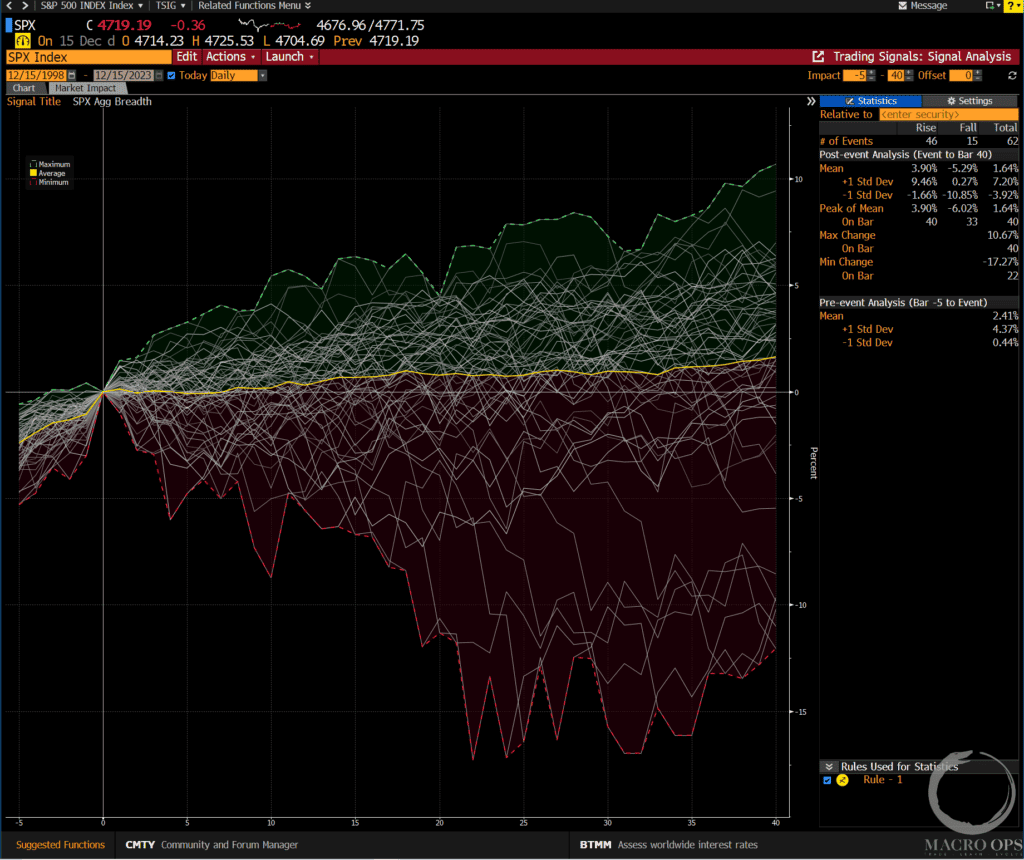
4. So while overbought levels do raise the short-term risk of seeing a consolidation/correction, an overbought market is often a sign of demand strength that precedes further gains. Further context is needed to help distinguish between the two.One contextual input we regularly track is market internals. And they continue to suggest the bullish trend is alive and well and the path of least resistance is up for now. We’ll turn more cautious when these roll over and/or our TF score rises above 90%.
5. The Russell 2000 (IWM) is knocking on both the top of its 18-month sideways range and its weekly Bollinger Band. We likely see it consolidate here but recent data (up next) suggests we soon see it break out to the upside.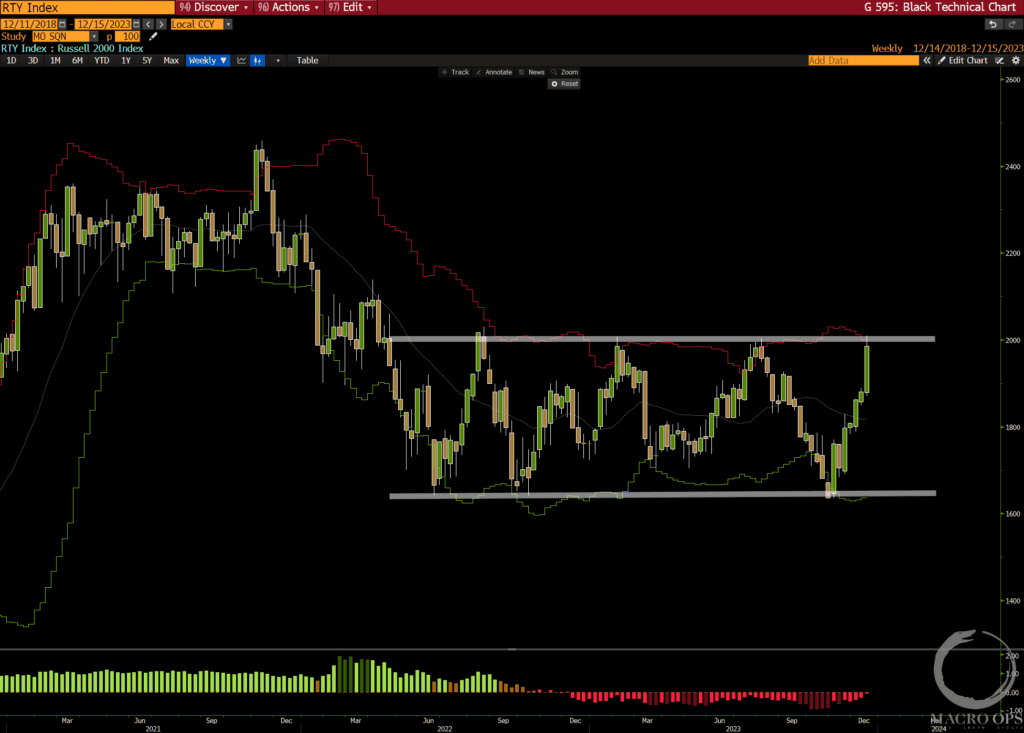
6. SentimenTrader noted last week that “the percentage of Russell 2000 stocks recording a 63-day high increased to 48%, reaching the 5th highest level in history.”
7. And “when the percentage of Russell 2000 stocks registering a 63-day high increased above 38%, returns, win rates, and z-scores for the small-cap index were outstanding. A year later, the index was higher every time.”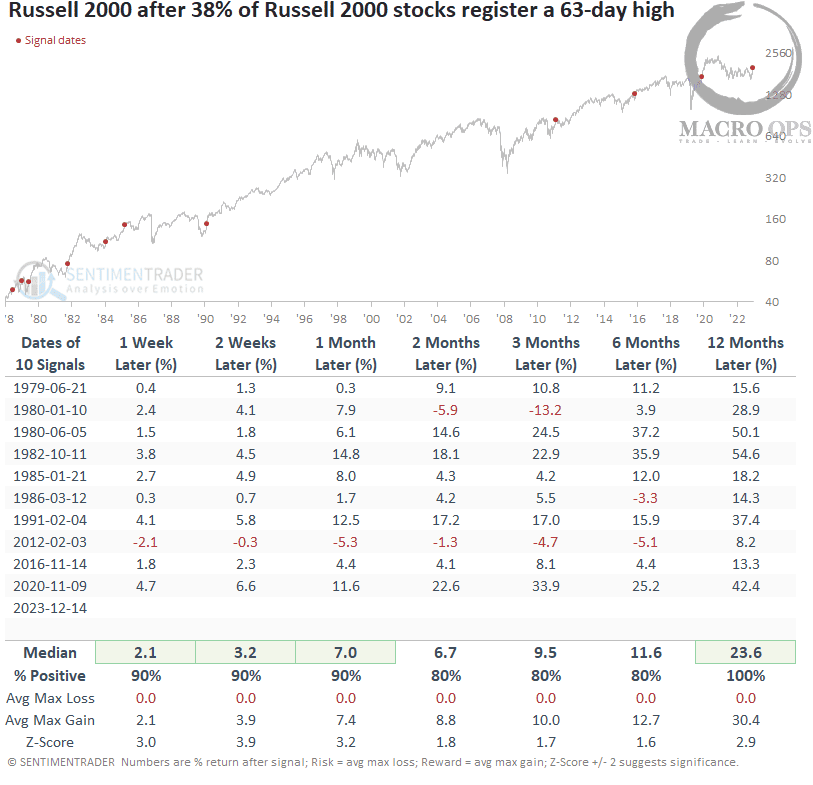
8. We’ve been long bonds for the past few weeks due to positioning/sentiment, a completed technical pattern, and our yield indicators diverging lower suggesting yields would soon follow suit (meaning, bonds up).But the reasons we got long are now telling us to take some profits or at the least, jam up our stops. Here we can see our Yield Lead indicator (red line) strongly diverging higher.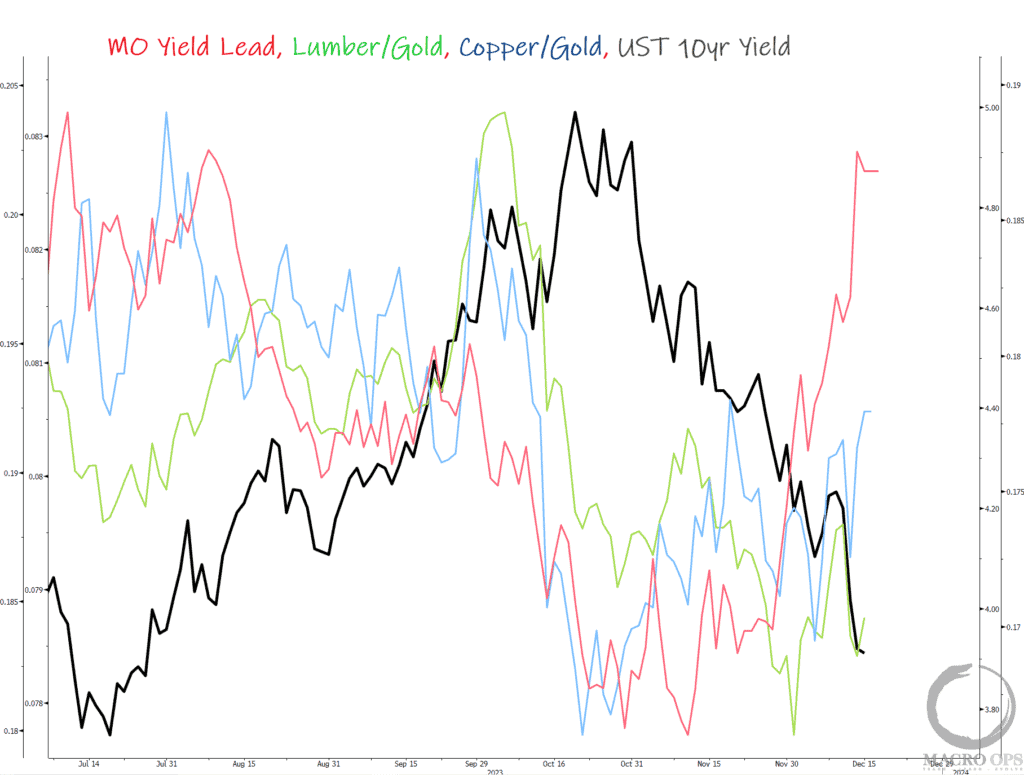
9. And 10s (ZN1) are bumping up against their upper weekly Bollinger Band. This doesn’t mean it’s time to turn bearish. It just means that the odds of a correction/consolidation in bonds have risen so we should manage accordingly.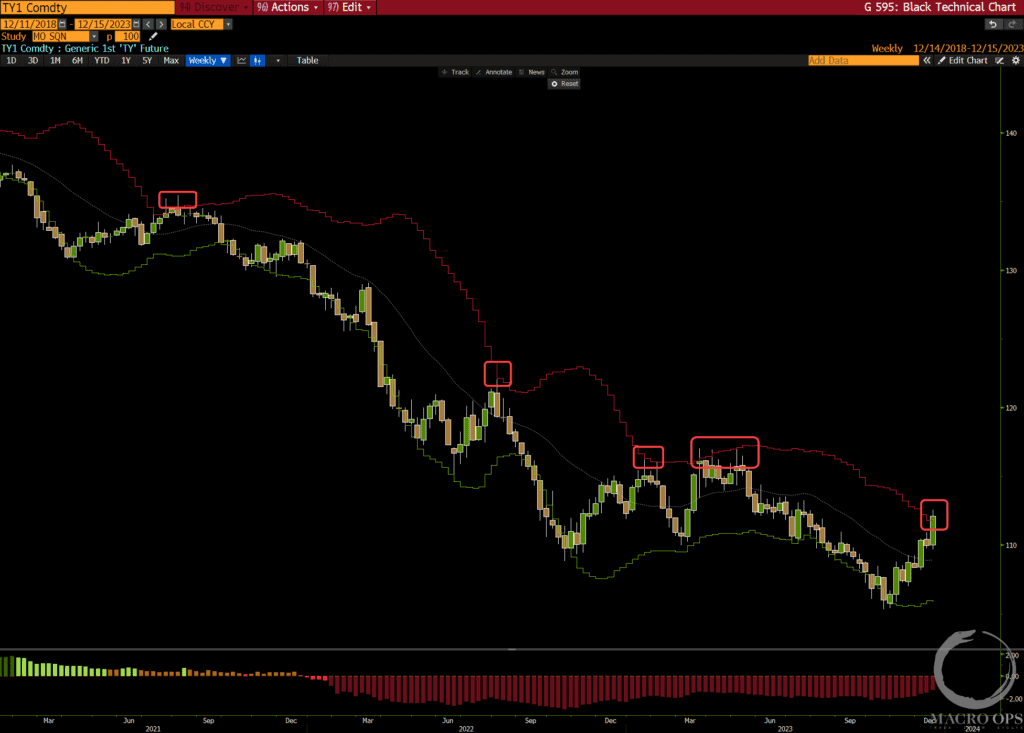
10. Look at the sectors/industries with the strongest consecutive returns on our returns heatmap. We have home construction, homebuilders, semiconductors, and consumer discretionary.This is not the type of leadership you see if you’re heading into a recession. This is cyclically bullish price action, which aligns with the broader weight of evidence that says the primary trend is up for risk assets.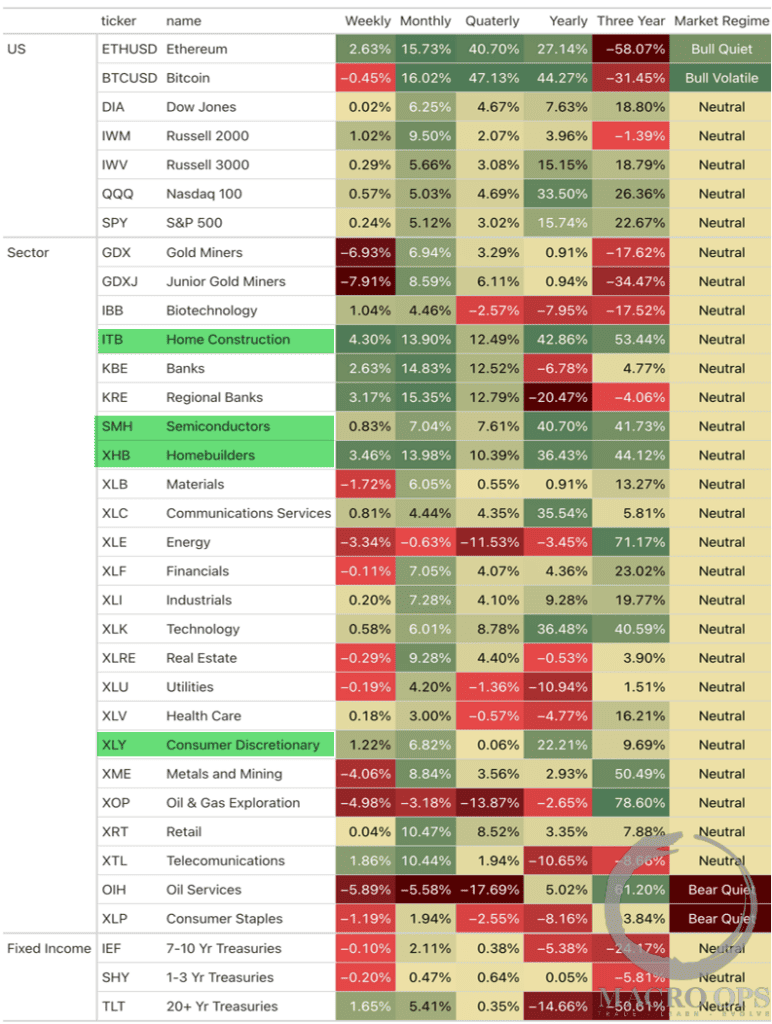
11. Speaking of small caps, we’re seeing a lot of technical strength in shippers (tankers, dry bulk, container, etc..). This aligns with the data suggesting the global economy has already put in an intermediate-low and we should therefore see a pickup in global trade.There are several great-looking charts in the space and one of the names we like is Navios Maritime Partners (NMM). Chart below is a weekly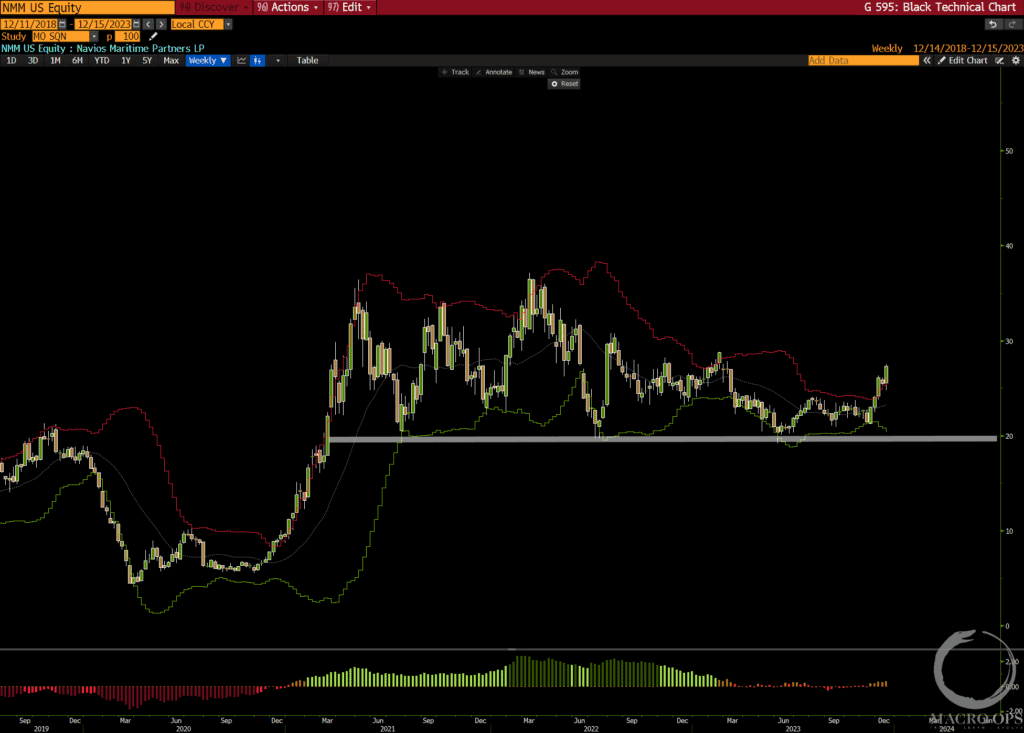
12. Not only is the stock breaking out from a 2yr coiling wedge pattern but it’s also trading on the cheap… Here’s a look at its current valuation relative to its historical multiples as well as its peers. (graph via Koyfin).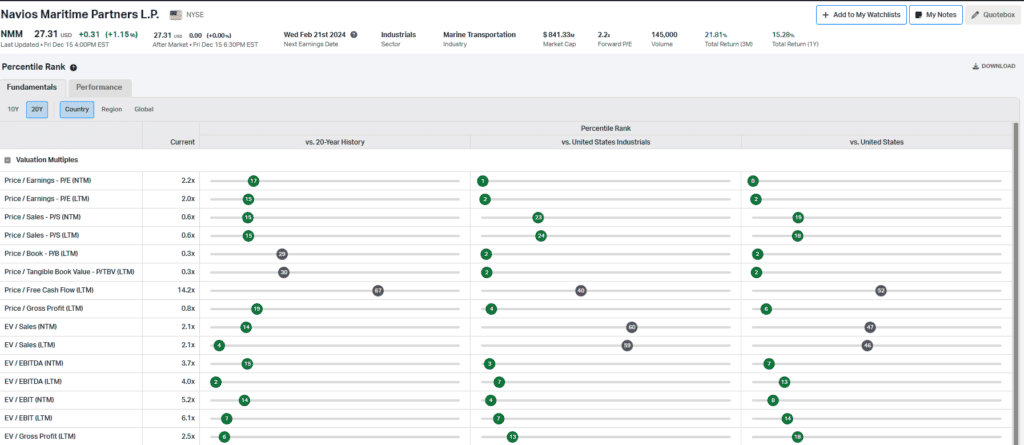 Thanks for reading.More By This Author:A Big Breadth Thrust In FinancialsMarket Headed To New All-Time Highs? Can The Gold Bulls Pull Through?


Leave A Comment