What happens when Morgan Stanley’s “rolling bear market” gets, well, rolling and hits virtually all markets?
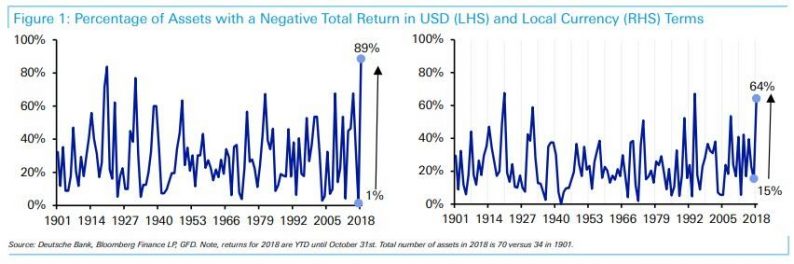
The answer is what Deutsche Bank’s Craig Nicol calls “a quite fascinating statistic” namely that as of the end of October, 89% of assets that Deutsche Bank collects data on for its annual long-term study, have a negative total return year to date in dollar terms. This is the highest percentage on record based on data back to 1901, eclipsing the 84% hit in 1920.

The German banks points out that while there are still two months to go in the year and much can change, ten months in and the figures are “fairly stark” and adds that “for equity markets in particular, returns are significantly negative so it would take a decent rally into year end to turn things around.”
This is what happens when the vast majority of global assets are expensive historically due to extreme monetary policy. When the tide goes out you’re more likely to get en masse negative months rather than rotation from day equities into bonds or visa-versa.
The record bearish print in this metric is made all the more interesting considering that just one year ago, 2017, was the ‘best’ year ever for markets on this measure, when just 1% of assets finished with a negative total return in dollar terms (only the Philippines bond market was negative).
Putting these two extreme years in context, since 1901 the average has been that 29% of assets finish a given year with a negative total return, leading Deutsche to exclaim that it’s been “an amazing couple of years nonetheless as we swing from one extreme to the other. It’s perhaps not a surprise that in this time major DM central banks have moved from peak global QE to widespread QT.”
For those asking, the universe of assets used by DB for this calculation includes 60 equity and bond markets, of which 40 are DM and 20 EM, 4 credit indices, 1 cash proxy index and 5 commodity markets. It is shown in the table below:


Leave A Comment