
This is part I of a 3-part series introducing Plunger’s “Trade of the Year”. This section gives a review of the oil price from 1946 to present explaining the essential forces which powered its price through various bull and bear markets. It explains how we ended up where we are today in the oil market. Part II will explore the macro forces driving today’s economy which lays the groundwork for introducing my trade of the year in part III.
To acquire a broader view of oils path over the past century I highly recommend the following resources on the oil market. Daniel Yergin’s “The Prize” is an in-depth review of the history of oil up to the First Gulf war. It is indispensable in understanding the growth of the industry. Other books provide entertaining color to the industry by reviewing the swashbuckling nature of the early players who formed the industry as independents. I recommend “The Big Rich” by Bryan Burrough and JP Getty’s autobiography “The Way I See It”. Finally, David Stockman’s “The Great Deformation” is essential reading as it corrects all the false economic narratives of the past which have been masquerading as truth.
Boom and Bust
That’s the essential nature of the history of oil over the past 140 years. It tends to be that way for most of the commodity sector is because the cycle of production leads to it. Commodity bull markets typically last about 10 years. That is about the amount of time required for the supply/demand process to go full circle. Initially inadequate supply leads to a price response which over time brings forth investment and exploration. At first conventional bank financing is hesitant to fund the sector since it is out of favor. This delays the formation of investment, but venture capital fills the void. Eventually the ensuing development brings forth supply and the prevailing narrative wakes up and recognizes the bull market. Conventional financing then funds the industry bringing forth development on a grander scale. Since this is a time consuming process supply is slow to keep up with demand thus price continues to become elevated (bull market). Elevated price calls out substitution of other energy sources (ethanol, nuclear, natgas, LNG,wind, solar, fracking). Over time development brings forth much greater supply with the discovery of new oil basins, (North Sea, Prudhoe Bay, Bakken, Eagle Ford, etc) and new supply eventually overwhelms demand which completes the circle and leads the market into the next phase which manifests itself as a bear market.
We have seen this process over and over since the discovery of oil. This is the nature of the commodity cycle. When we overlay monetary policy onto this cycle it exasperates the depths and length of this natural cycle leading to euphoric bull markets and crushing bear markets.
Explosion in Demand
World energy consumption quadrupled between 1945 and 1972, with oil demand increasing by more than six times. World wide economic growth and the rise of the middle class led to staggering demand for oil products. The amazing thing from a current day perspective is that despite this growth in demand the price of oil was relatively stable. In the two charts below we see the nominal price appearing to virtually flat line from 1949-1972 while the real price (CPI adjusted) actually was cut by 1/3 over this period.
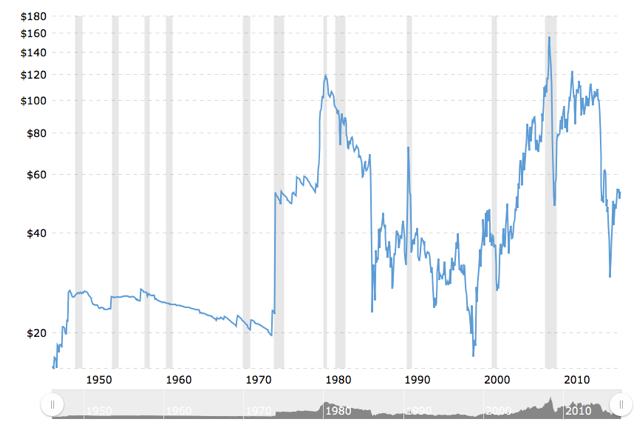

Note the first chart shows the real price of oil actually decreasing through out the decade of the 1960’s while the second chart shows oils nominal price increasing moderately from 1949-1973.
Bretton Woods- Postwar golden age and the fuel for monetary chaos.
“Inflation is always and everywhere a monetary phenomenon”- Milton Friedman.
To understand the oil market and price from 1946-1980, It is essential to understand the monetary backdrop of that era. The Bretton Woods monetary regime defines the grand movements of the oil price over this period. This agreement set up the post WWII monetary system which lasted until August 15 1971. It established the USD as the center of the world’s monetary system. Exchange rates were pegged to gold since foreign governments could exchange their accumulated dollars for gold from the US treasury. This anchored currencies to the USD and the USD was anchored to gold. It provided a stable monetary system and enforced financial discipline by limiting the expansionist policies of government to their ability to tax its citizens.
In the early years it served the West well, however by the early 1960’s the golden era of FED/Eisenhower financial discipline was over. The USA no longer desired this discipline and began to abuse its “exorbitant privilege” by “printing money” (expanding credit). It greatly expanded the money supply well above its taxing powers to pay for its imperial wishes. Social programs and its wars required vast money printing. The Bretton Woods system allowed the increased supply of dollars held by foreign governments, caused by money printing, to be exchanged for gold from the US treasury. These dollars represented debts owed to others by the US government, however the intent was to never pay. This is known of course as theft.
The London Gold Pool
In order to keep this lucrative arraignment of expanding the money supply over and above the creation of real wealth it became necessary to disguise what was really going on. The US after all was supposed to be anchoring the USD to a limited asset, namely gold. Throughout history gold production has only been able to grow at about 1%/year. The USD was being increased many times this rate. Since gold is a monetary asset (not a commodity) its price quickly reflects any monetary debasement occurring by central banks. So in order to keep the game under wraps the monetary powers set out to suppress the price of gold. A rising gold price announces to the world that debasement is ongoing and threatens the game.


Leave A Comment