Intermediate-Term vs. Long-Term
With concerns related to next week’s election and the strong possibility of a December rate hike, the stock market’s intermediate-term profile has shown some significant deterioration in recent weeks. From MarketWatch:
U.S. stocks ended a volatile session with modest losses on Friday, pressured by the surprise announcement that the Federal Bureau of Investigation was restarting a probe into Hillary Clinton’s emails, adding a new dose of political uncertainty into the market.Major indexes had traded higher earlier in the session, supported by a strong GDP reading, but the news prompted a turnaround and extended the week-to-date declines of the S&P 500 and Nasdaq. However, indexes also ended well off their lows of the session as investors digested the news and its potential implications for the coming election.
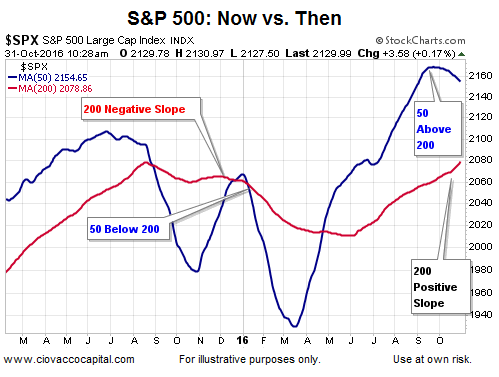
In the S&P 500 chart below, the 50-day moving average (blue) helps us monitor the health of the intermediate-term trend; the 200-day moving average (red) assists with the market’s long-term trend. The 50-day recently rolled over, which is indicative of waning intermediate-term momentum. Currently, the slope of the 200-day looks quite a bit better than it did before the 2016 New Year’s plunge, telling us the present day long-term outlook is quite a bit better than it was on January 1, 2016.

Possible Buying Opportunity
Given current valuations and the relatively disappointing state of global growth, it is easy to understand the long-term bearish case. Is there any long-term evidence that can help us keep an open mind about better than expected long-term outcomes? The answer can be found in this week’s video.
From a fundamental perspective, a recent MarketWatch headline, “Residential Building Can’t Keep Pace With Seattle’s Surging Job Market”, seems incongruent with the end of the world is around the corner theory. From the article:


Leave A Comment