
Investors love a good turnaround, where a struggling firm restructures to achieve newfound profit growth. Too often, during the turnaround, investors overlook issues and send shares higher regardless of signs that the turnaround is not working as expected. They get caught up in the turnaround story and don’t realize until too late that the story is untrue.

This company has executed its turnaround strategy, but the excepted results (improved profits) have failed to materialize. Instead profits continue to fall, margins lag peers, and strategic initiatives fail to deliver tangible results. Throw in an overvalued stock price and its clear why hair salon operator Regis Corporation (RGS: $17/share) is this week’s Danger Zone pick.
Profit Declines is Outpacing Revenue Decline
Since fiscal 2007, RGS’ revenue has fallen 4% compounded annually. At the same time, RGS’ after-tax profit (NOPAT) has fallen 12% compounded annually to $46 million in 2017. More recently, NOPAT has fallen from $48 million in 2015 to $26 million TTM. Meanwhile, GAAP net income has improved from -$34 million to -$7 million over the same time, per Figure 1. Investors looking solely at reported numbers would believe RGS’ profits are on the rise despite NOPAT continuing to fall.
Figure 1: RGS’ NOPAT Since 2007
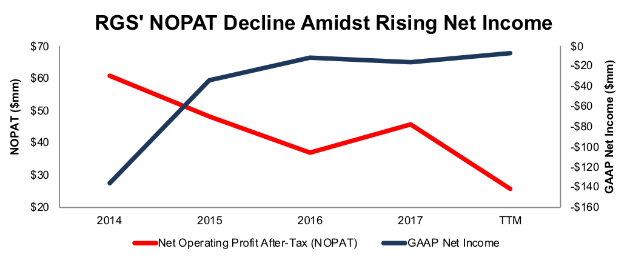
Sources: New Constructs, LLC and company filings
The rapid deterioration in NOPAT comes from NOPAT margins falling from 6% in fiscal 2007 to 2% TTM. At the same time, average invested capital turns, a measure of balance sheet efficiency, have fallen from 0.9 in 2007 to 0.6 TTM. Falling margins and inefficient capital use have dropped RGS’ return on invested capital (ROIC) down from 6% in fiscal 2007 to 1% TTM.
Compensation Plan Rewards Execs While Destroying Shareholder Value
Regis Corporation’s executive compensation plan fails to properly align executives’ interests with shareholders’ interests. The misalignment helps drive the profit decline shown in Figure 1 and enables executives to earn large bonuses while shareholder value is destroyed.
Executives’ annual bonuses are tied to cash flow per share and same store sales growth metrics. Long-term incentive compensation is awarded via time-based restricted stock units and performance stock units tied to adjusted EPS targets. Cash flow per share is calculated using adjusted EBITDA, which removes many true costs of doing business. Adjusted EPS includes many of the same adjustments as adjusted EBITDA.
The bottom line is that executives are incentivized by metrics that have allowed execs to earn bonus awards while destroying shareholder value. Since 2012, RGS’s economic earnings, the true cash flows of the business, have fallen from $23 million to -$95 million TTM. This poor capital allocation is not new either. Per Figure 2, RGS’ ROIC has been in long-term decline.
Figure 2: RGS’ ROIC Since 1998

Sources: New Constructs, LLC and company filings
We’ve demonstrated through numerous case studies that ROIC, not EBITDA or adjusted EPS, is the primary driver of shareholder value creation. A recent white paper published by Ernst & Young also validates the importance of ROIC (see here: Getting ROIC Right) and the superiority of our data analytics. Without major changes to this compensation plan (e.g. emphasizing ROIC), investors should expect further value destruction.
Non-GAAP Metrics Mask Large Losses
Regis Corporation uses misleading non-GAAP metrics to mask the deterioration in the true economics of the business. Metrics used include non-GAAP operating income, adjusted EBITDA, non-GAAP gross profit, and non-GAAP net income. Our research digs deeper so our clients see through these misleading financial metrics.
The adjustments made have a large impact on the disparity between GAAP net income, non-GAAP net income, and economic earnings. In the first half of fiscal 2018, RGS removed over $34.4 million of expenses (6% of revenue) to calculate non-GAAP net income, including over $24 million in restructuring costs. In fiscal 2017, RGS removed over $18.8 million of expenses (1% of revenue) from GAAP net income to calculate non-GAAP net income. After all adjustments, RGS reported fiscal 2017 non-GAAP net income of $2.7 million. Per Figure 3, GAAP net income was -$16 million and economic earnings were -$68 million.
Figure 3: RGS’ Non-GAAP Metrics Hide Declining Economic Earnings
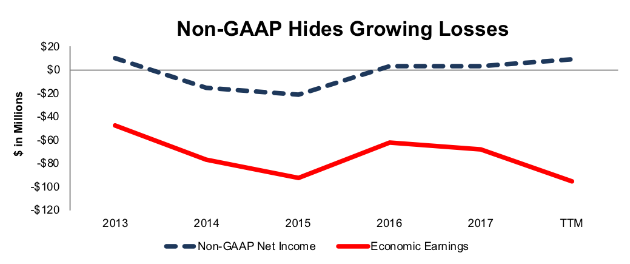
Sources: New Constructs, LLC and company filings
High Cost Structure and Low Margins Create Competitive Disadvantage


Leave A Comment