
AT40 = 43.3% of stocks are trading above their respective 40-day moving averages (DMAs)
AT200 = 60.5% of stocks are trading above their respective 200DMAs
VIX = 11.9 (volatility index)
Short-term Trading Call: neutral
Commentary
Times like these really put AT40 (T2108), the percentage of stocks trading above their respective 40-day moving averages (DMAs), to test.
The stock market’s underpinnings continued their slides on Wednesday with AT40 dropping to a level last seen the day after the U.S. Presidential election. AT200 (T2107), the percentage of stocks are trading above their respective 200DMAs, dropped in unison and confirmed the end of its uptrend. Bullish momentum has come to an end.
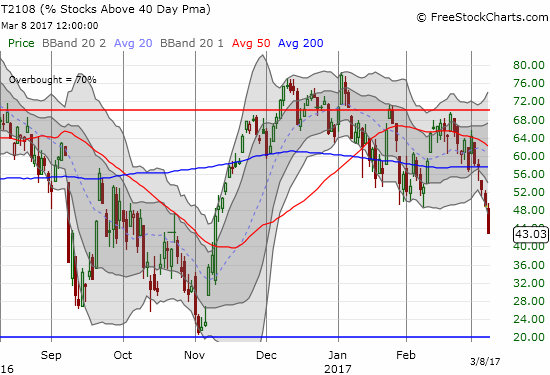
AT40 (T2108) traded below 50% for the first time since the day after the U.S. Presidential election.
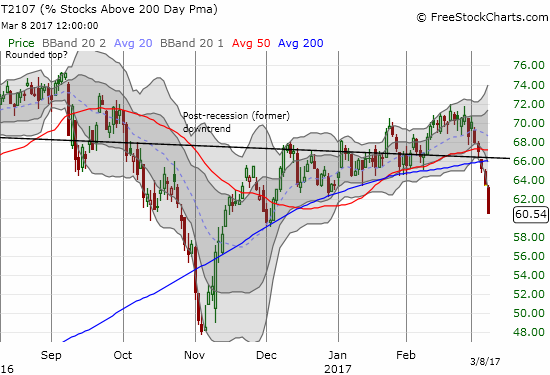
AT200 (T2107) plunged to a new three-month low and confirmed the end of its post-election uptrend.
A trader may never guess at the weakening foundations while watching the S&P 500 (SPY) drip ever so slowly downward. The hardy index STILL did not close below the low of the day before its last bullish breakout – a threshold I have held out as the dividing line between a neutral and a bearish stance on the market.
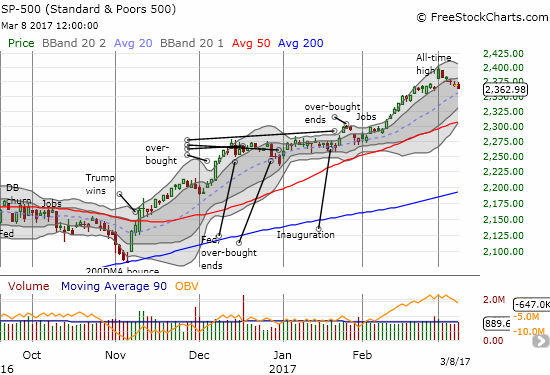
The S&P 500 (SPY) fell a mere 0.2% and once again stopped short of triggering a bearish trading call.
The volatility index, the VIX, once again showed little interest in flagging trouble ahead.
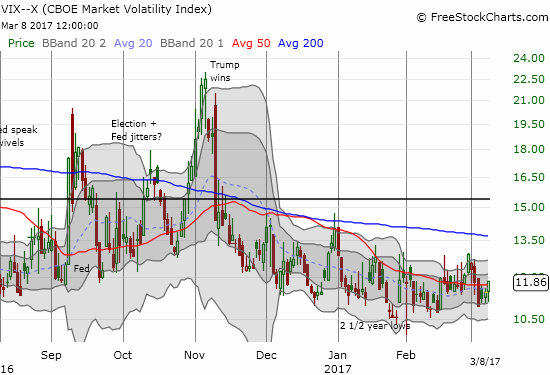
The volatility index, the VIX, still shows little concern as it gained just 3.6% on the day. However, a bottom may be forming?
With this conflicting setup creating what looks like a “quiet” breakdown a week before the Fed meets, I decided to look at some other technical indicators related to AT40: T2114 and T2116. These indicators measure the percentage of stocks that are a certain distance below their 40DMAs. The bigger the number, the worse off the stock market is. T2114 measures the distance by one channel – think of it as a Bollinger Band channel or approximately one standard deviation. T2116 is two standard deviations. The charts below suggest there is increasing stress under the hood of an otherwise serene market. A quiet breakdown is indeed underway. The upshot is that a fresh BUYING opportunity will likely accompany these indices on a retest of former highs. In other words, whatever extended sell-off awaits around the corner will likely be shallow and brief (don’t blink?).


Leave A Comment