(“Above the 40” uses the percentage of stocks trading above their respective 40-day moving averages [DMAs] to assess the technical health of the stock market and to identify extremes in market sentiment that are likely to reverse. Abbreviated as AT40, Above the 40 is an alternative label for “T2108” which was created by Worden. Learn more about T2108 on my T2108 Resource Page. AT200, or T2107, measures the percentage of stocks trading above their respective 200DMAs.)
AT40 (T2108) Status: 60.3%
AT200 (T2107) Status: 68.4%
VIX Status: 11.0
Short-term Trading Call: neutral
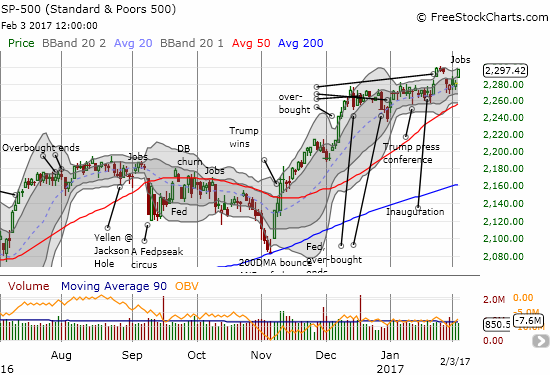
Nothing says “strong sentiment” like a stock market that actually rallies on a strong U.S. jobs report: the fear of the implications for hawkish monetary policy has seemingly disappeared. The S&P 500 (SPY) jumped 0.7% in the wake of the report on January jobs. The index closed within a point of its all-time high. The NASDAQ (QQQ) pushed to a new all-time high by 6 points.

The S&P 500 moves within “inches” of invalidating its 3-day abandoned baby top.
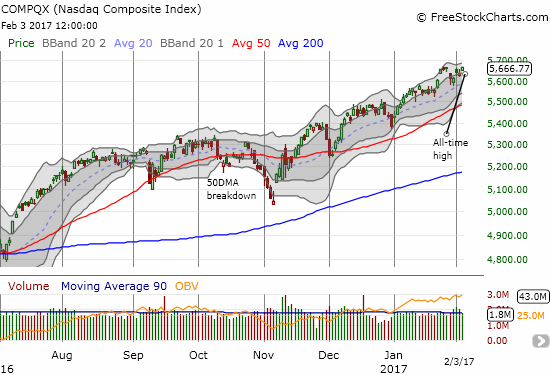
The NASDAQ closed at a new all-time high
The current rally has been one of the more stealthy (and halting) ones in a long time.
After the NASDAQ bounced off its pre-election low on November 4th, it made a statement after December 1 when it bounced off support at its 50-day moving average (DMA) with a 20DMA newly trending upward. The S&P 500 on the other hand came to a screeching halt after its December high on the 13th. Its breakout on January 25th should have heralded a confirmation of a new bullish turn but instead the index came to another complete halt. THAT pause turned toppy when the index gapped down and formed a 3-day abandoned baby top. Amazingly, the S&P 500 failed to close cleanly below my line in the sand at 2,280 marking off bearish territory. Now, the index has come back to attempt an invalidation of the bearish topping pattern.


Leave A Comment