
The Quality Score produces 16.8% CAGR in the tests that I’ve performed for the upcoming “Action Score” that I’m implementing into Old School Value.
Next is the Value Score.
Here is the full table of results again.
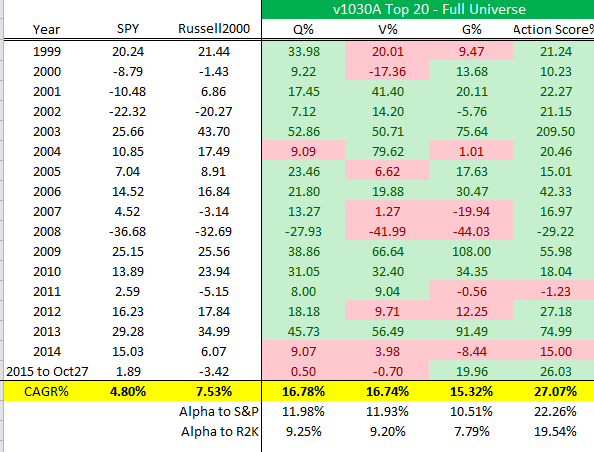
If you followed this strategy, the 16.74% is the max return. After fees, it likely comes down to 13-14% range annualized.
Here’s How I Created the Value Score
When you create a ranking system (or even a screener) the higher the number of criteria, the worse the performance becomes.
When picking individual stocks, making sure a stock passes lots of checks is a good strategy because you allocate based on your conviction. However, when you try to employ any sort of quantitative strategy, it is not a good idea to list 20 different criteria that must be passed.
Of all the tests I’ve performed, a strategy with lots of checks consistently lose to the market by a wide margin.
I mention this because people ask me whether I’ve tried combining several of the best performing value screeners on display.
I have.
And the results are pathetic.
It severely handcuffs the number of stocks that pass and the screen ultimately fails.
When you pick stocks individually, you have to be precise and picky.
For anything quant based, it needs to be looser as you are buying a bunch.
As I mentioned in the Quality Score article, instead of blindly coming up with metrics for each Q, V and G, I already had a list of metrics for each methodology based on previous research papers and proven results.
Then the theory was tested and confirmed via backtesting.
In it’s purest form, the Value Score is based on the following 3 factors:


Leave A Comment