

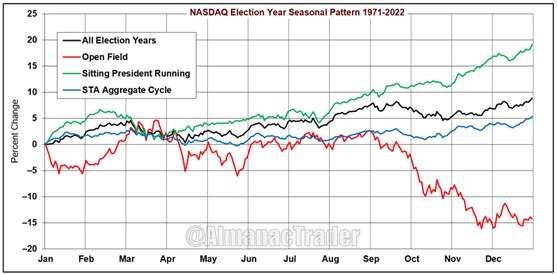
 In the above chart, we have plotted the same four seasonal patterns that are in the 2024 Almanac on page 11 using S&P 500 data (please note, NASDAQ data begins in 1971). When compared to the longer history of the S&P 500, NASDAQ’s patterns are very similar to S&P 500.The most bullish scenario is when there is a sitting president running for re-election. In those years, NASDAQ has averaged a full-year gain of 19.14%. This is much stronger than the 12.73% average gain in all years and the 8.87% average advance in all election years.Pre-election year-end strength also continues into January and February of election years. We maintain our bullish outlook for the balance of the year.More By This Author:Inflation, Growth, & Credit: What To Expect From These Three Economic Drivers FCX: A Great Way To Invest In Gold (And Copper, Too!) EMXC: A Way to Get Global Market Exposure Without China-Related Drag


Leave A Comment