The gold stocks bounced strongly on Friday after the February jobs report confirmed the Federal Reserve will hike interest rates next week. While precious metals rallied strongly following the previous two hikes, I’m not so sure Friday marks the start of a big rebound. For one, the Federal Reserve could hike rates again in July. Second and more important, the technical setup argues for more back and forth action in the weeks and months ahead. While the current price action in the gold stocks is different from that in the previous cyclical bull markets, we do think we have found one viable comparison for the current correction.
Although the gold stocks may rally for a few weeks in the short-term, I see them testing the December lows or close to those lows before retesting their February peaks. If this occurs and the correction that began last summer remains in effect, then what does that mean for the larger picture?
Put simply, the gold stocks formed a historic low in January 2016 and are undergoing a sizeable correction (in price and time) to the record advance that took place in the first half of 2016. A long and deep wave 2 correction, though not typical has a few historical examples.
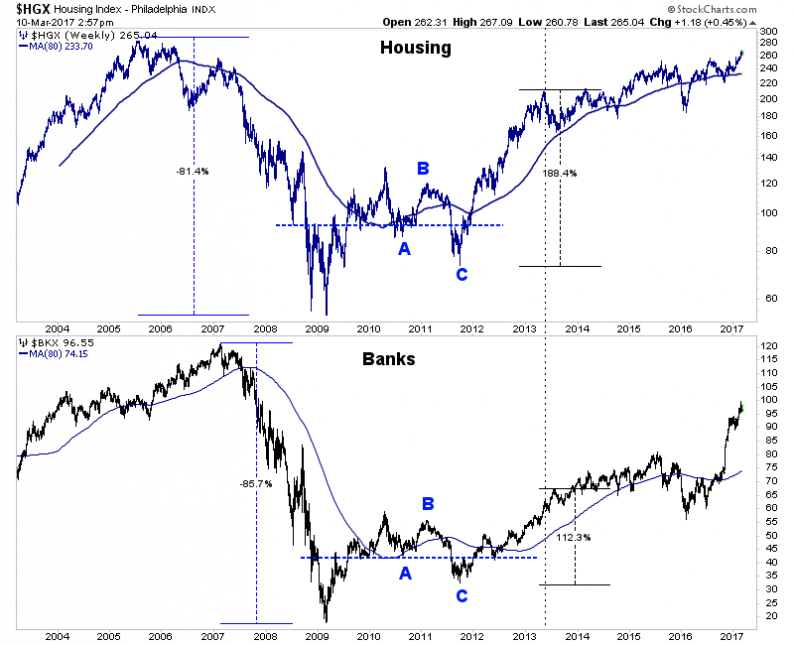
In the chart below we plot the housing and banks sectors, which endured a sizeable wave 2 correction (in price and time) in 2010-2011 before exploding higher from late 2011 to early 2013.

These two sectors share several key similarities to the gold stocks at present. They endured a devastating bear market of more than 80%. (It was the worst bear market in over 80 years). They rebounded strongly from their historic 2009 bottoms. In particular, the banks surged 250% in 12 months. Then both sectors corrected 44% in a correction that lasted 17 months and longer than the initial rebound. Finally, note that the banks and housing sectors experienced a technical breakdown (C leg) in late 2011 that effectively served as a massive bear trap and a tremendous buying opportunity.


Leave A Comment