By Tony A., h/t @ChesapeakeCap
This is an analysis of past 100-bagger stocks. A 100-bagger is a stock which increases in value 100 fold (e.g., a stock which goes from $1 to $100). The term “bagger” [as applied to stocks rather than baseball] was popularized by Peter Lynch, the former fund manager of Fidelity Magellan. He actually spoke most often of 10-baggers, however I figured that looking at 100-baggers would be more fun. By looking back I hoped to discover some common characteristics which would aid me in identifying potential multi-baggers of the future. Of course all my analysis is grounded in the fundamentals of companies. However once I find those stocks with the fundamentals I like, it was my hope that this exercise would help me to understand better why some stocks appear to go nowhere despite solid fundamentals while others make dizzying advances, how long those moves can last, when to enter and when to exit, etc.
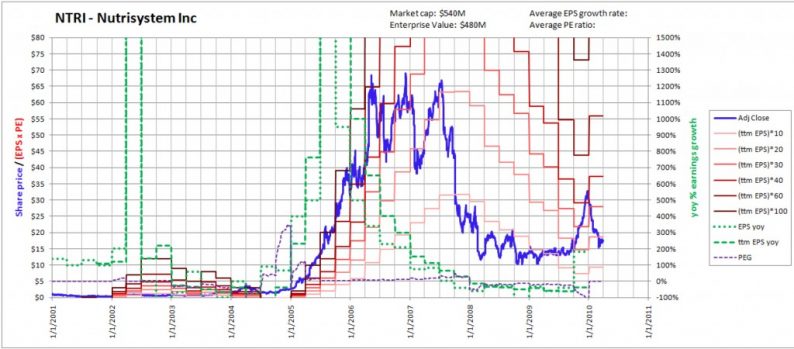
I will be including lots of charts so I should describe their format. I make my own charts because I want to see certain things on them not normally present on stock charts (such as earnings lines, growth rates, and PEG ratios). Below is the chart of NTRI, a 100-bagger I will go over in more detail later.

In blue is the adjusted closing share price (adjusted for stock splits). The pink through dark red step function lines are the trailing twelve month EPS times various multiples (see the legend on the right). All EPS figures have also been adjusted for any stock splits. These lines, like the closing price, are read on the left-hand scale. The green step function lines are the year over year percentage change in quarterly EPS (green dotted line) and ttm EPS (green dashed line). These are read on the right-hand scale. In the charts I’ll be showing of the 100-baggers I only plotted the green dashed line because it was too cluttered with the yoy quarterly EPS growth rates displayed. Note that the “steps” of both the red and green lines are three months wide, representing the figure for that quarter. Lastly, the dashed purple line is the PEG ratio (PE ratio divided by growth rate). Here I defined my PEG ratio as the ttm PE ratio divided by the yoy percentage change in ttm EPS. I defined it this way mostly for convenience, but the result is that it is more of a backwards looking PEG ratio as opposed to a forward looking PEG ratio. The purple line is also read on the right hand scale, with 50% being a PEG ratio of .5, 100% being a PEG ratio of 1, and so on.
I will start by sharing some of the conclusions I reached.
1) The most powerful stock moves tended to be during extended periods of growing earnings accompanied by an expansion of the PE ratio. And when I mention earnings, I mean earnings per share. For example take a stock which has ttm EPS of $1 and a ttm PE ratio of 10. The stock is trading at $10. Say over the next few years the stock grows ttm EPS to $2.5 and the market rewards the stock with a ttm PE ratio of 40. The stock is now trading at $100, resulting in a 10-bagger. The increase in stock price was far greater than the increase in earnings due to the PE expansion. Likewise, the most powerful moves to the downside were during periods of decreasing earnings accompanied by PE contraction.
2) These periods of PE expansion often seem to coincide with periods of accelerating earnings growth. By that I mean a period when earnings growth rates are not just being maintained, but are increasing sequentially. For example consider the following two hypothetical stocks, “FLAT” and “ACC”. Say that both FLAT and ACC had EPS in 2000 of $4, $1 in each quarter of 2000. FLAT has 2001 earnings of $1.25 in Q1 (25% growth rate yoy), $1.25 in Q2 (25% growth rate yoy), $1.25 in Q3 (25% growth rate yoy), and $1.25 in Q4 (25% growth rate yoy), for total earnings in 2001 of $5 per share (25% growth yoy). ACC has earnings in 2001 as follows: $1.10 in Q1 (10% growth rate yoy), $1.20 in Q2 (20% growth rate yoy), $1.30 in Q3 (30% growth rate yoy) and $1.40 in Q4 (40% growth rate yoy), for total earnings in 2001 of $5 per share (25% growth yoy). For the full year 2001 both FLAT and ACC grew earnings by 25% yoy. However ACC’s yoy earnings growth rate was increasing quarter to quarter, while FLAT’s growth rate was staying steady throughout the year. Now I’m not saying one is better than the other. In fact accelerating earnings growth rates are inherently less sustainable than steady growth rates. However in the past 100-baggers I looked at accelerating growth rates appeared more likely to coincide with PE expansion.


Leave A Comment