
We’ve got a new week on tap so let’s get started with a review of my key market models/indicators and see where we stand. To review, the primary goal of this exercise is to try and remove any subjective notions about what “should” be happening in the market in an attempt to stay in line with what “is” happening in the markets. So, let’s get started.
Note that we’ve upgraded a few of our models this week (the upgraded models have been highlighted). See “my takeaway” below for more details.
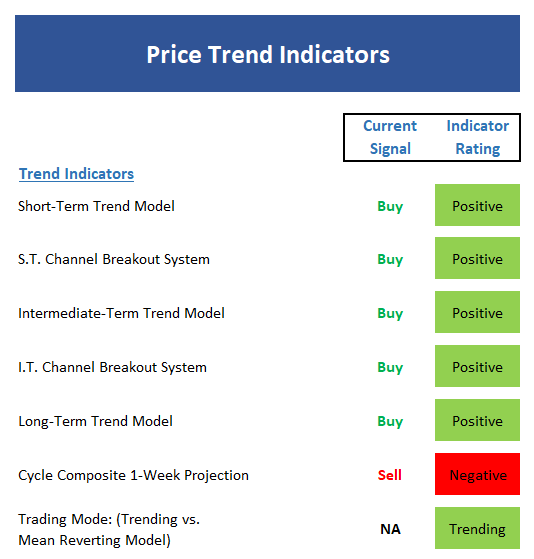
The State of the Trend
We start our review each week with a look at the “state of the trend.” These indicators are designed to give us a feel for the overall health of the current short- and intermediate-term trend models.
Executive Summary:
With the market closing at yet another all-time high on Friday, it should not be surprising to see all three trend models positive.
Ditto for the short- and intermediate-term Channel Breakout Systems
The Cycle Composite, which is CLEARLY out of sync at the present time, points south again next week before turning green the week after.
The Trading Mode models tell us that stocks remain in a “trending” mode.
In summary, sometimes it is best not to overcomplicate things. So, as the saying goes, the trend is your friend here.
The State of Internal Momentum
Next up are the momentum indicators, which are designed to tell us whether there is any “oomph” behind the current trend.

Executive Summary:
Both the short- and intermediate-term Trend and Breadth Confirm Models are positive again this week.
The Industry Health Model continues to flirt with positive territory but once again has fallen just shy of the mark this week.
The short-term Volume Relationship remains positive, but the up-volume line has started to roll over a bit recently. While not a problem, this remains something to keep an eye on for signs of weakening momentum.
The intermediate-term Volume Relationship remains in good shape from a near-term perspective.
The Price Thrust Indicator continues to reside in the green.
Although the Volume Thrust Indicator is neutral, the historical return in this mode is above the long-term mean.
Ditto for the Breadth Thrust Indicator. The reading is neutral but the historical return is strong.
All in, the momentum board is in good shape and there is not a lot to complain about.
The State of the “Trade”
We also focus each week on the “early warning” board, which is designed to indicate when traders might start to “go the other way” — for a trade.

Executive Summary:
From a near-term perspective, stocks reamain oversold. However, since this has been the case since the end of August, the current condition should be viewed as a sign of strength.
From an intermediate-term view, stocks are now very overbought. But again, this is what happens during long uptrends and an intermediate-term oversold condition would likely become a strong buy signal – but everyone knows this!
The Mean Reversion Model remains stuck in never-never land.
The short-term VIX indicator flashed both a sell and a buy on an intraday basis last week. However, on a closing basis, the last signal was a sell.
Our longer-term VIX Indicator remains on its August buy signal.
From a short-term perspective, the market sentiment model remains solidly negative as optimism about the market’s prospects continues to increase.
The intermediate-term Sentiment Model is also negative.
Longer-term Sentiment readings show extreme complacency and high levels of optimism.
The State of the Macro Picture
Now let’s move on to the market’s “external factors” – the indicators designed to tell us the state of the big-picture market drivers including monetary conditions, the economy, inflation, and valuations.

Executive Summary:
With rates trending higher since early September, absolute monetary conditions continue to weaken within the neutral zone.
The Relative Monetary Model is also holding in the neutral zone this week.
In order to provide a better “external” view of the market environment, we have switched to an economic model designed to indicate the current growth rate of the economy. Currently the model suggests “strong” economic growth.
The reading of our Inflation Model continues to slide and while still neutral, it is very close to moving into the “low inflation” mode – which has historically been quite positive for the stock market.
The Absolute Valuation Model remains elevated. However, we should note that the model reading continues to trend lower as earnings are growing at a faster pace than stock prices.
Our Relative Valuation Model remains in the neutral zone due to the historically low level of rates.


Leave A Comment