
Primary dealer holdings of UST securities have been on the rise again. This sort of warehouse activity is drastically misunderstood, exemplified best when last year around this time surging dealer inventory was blamed on those banks’ purported inability to sell off their holdings. It was an absolutely absurd idea for several reasons, but most prominently the overwhelming demand at the time for those very securities.
At +$49 billion, net, across all coupons (but not TIPS), and +$64 billion including bills, dealer inventory levels are as high now as they were in early January 2016 during that initial liquidation phase. Those levels are up from +$25 billion coupons and +$45 billion including bills to start this year.

Despite “reflation”, clearly dealers aren’t yet willing to disgorge their holdings as enthusiastically as they did in 2013, let alone 2011 and nothing even approaching the pre-crisis era. It is another area where this “reflation” is appreciably less embraced than the last one. In terms of this data set, what we are seeing are systemic as well as tactical liquidity preferences being expressed by those directly inside of the wholesale (shadow) world.
Since dealers by and large are not speculating on the direction of interest rates either way, their tendency toward a net positive position or a net negative one relates more to collateral and financing opportunities versus costs. Perhaps the largest potential “cost” is volatility, where in repo markets funding inflexibility can be expressed as dealer “hoarding” of UST’s or MBS. That is, in fact, what we find at each interval of crisis going all the way back to the summer of 2007.
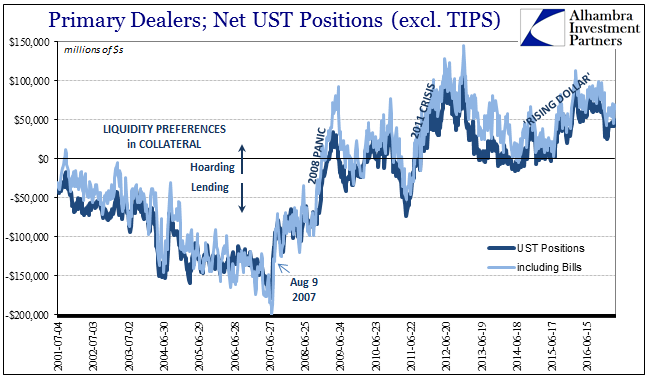
Again, not only do we find these individual episodes or funding spasms in the direction of “hoarding”, overall there is a clearly established structural break right in August 2007. The differences in how each version of “reflation” has played out are very much like the shrinking of eurodollar or UST curves over the last decade.


Leave A Comment