

The EUR/USD currency pairTechnical indicators of the currency pair:
The ISM manufacturing index in the US for November contracted more than expected, which is a dovish factor for the Fed’s policy. Meanwhile, dollar losses accelerated on Friday after US Fed Chairman Jerome Powell and Chicago Fed President Goolsbee announced their support for keeping interest rates unchanged at the upcoming FOMC meeting on December 12-13. The Eurozone Manufacturing PMI for November was revised upward by 0.4 to 44.2 from the initially published reading of 43.8. The Euro was thus supported towards the end of the trading week and managed to close in positive territory. This week, the Eurozone GDP data for Q3 will be published, where the economy is expected to shrink, which may negatively affect the European currency, especially if the US labor market data is strong.Trading recommendations
The trend on the EUR/USD currency pair on the hourly time frame is bullish. On Friday, the price fell below the level of priority change but could not consolidate below — buyers took the initiative, after which the price managed to close in the positive territory. Now, the price has found the resistance level at 1.0894, and if the buyers fail to break it and the price falls below 1.0851 again, the medium-term trend will be for the sellers. Under such market conditions, it is better to consider buying after a true breakout of 1.0894 with a target of 1.0961. Sell deals can be considered intraday from moving average levels but with confirmation and short targets as the price is near support levels.Alternative scenario: if the price breaks the support level of 1.0851 and consolidates below it, the downtrend will likely resume. 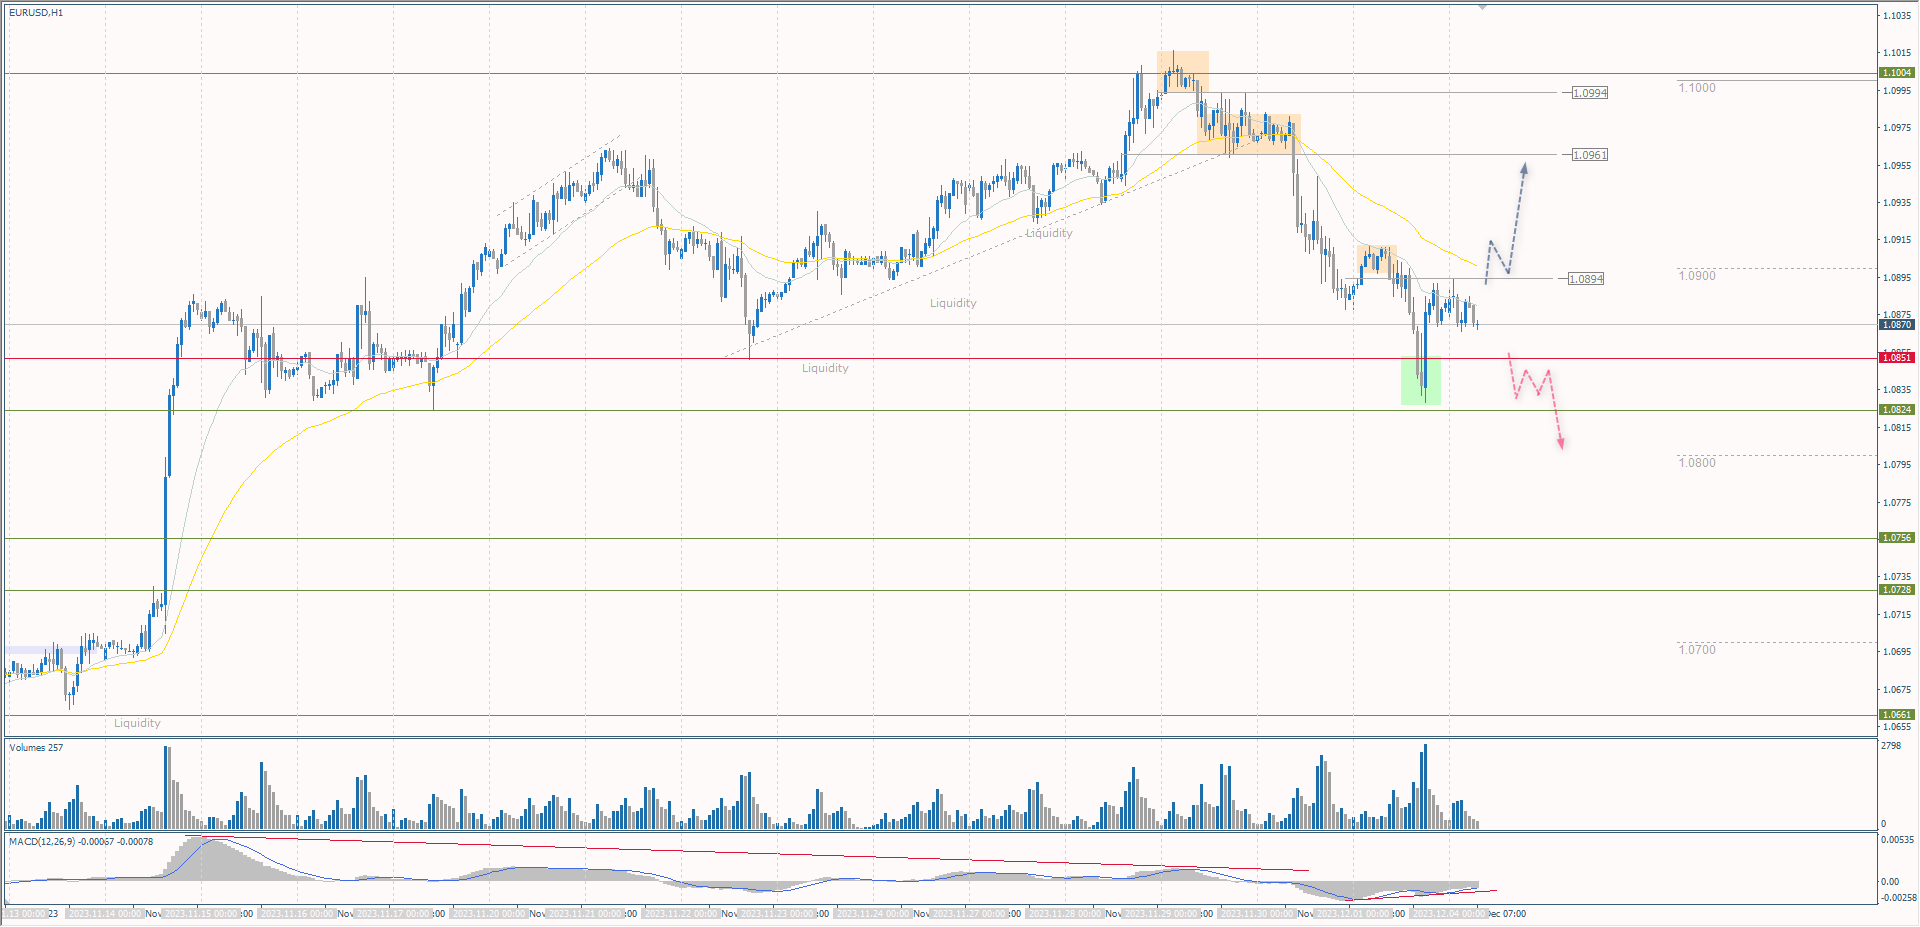 News feed for 2023.12.04:
The GBP/USD currency pairTechnical indicators of the currency pair:
Since the end of September, the British pound has been rising quite consistently against the US dollar, but this has mostly been a manifestation of “dollar weakness” rather than a vote of confidence in Sterling. This is because the Bank of England is much further away from cutting rates than the Federal Reserve. Currency markets believe that US borrowing costs could start to fall in the first half of next year, while UK rates could remain high until the end of 2024. According to economists, the price of GBP against the dollar is now somewhat overvalued to its real value, so there is a high probability of a correction.Trading recommendations
From the point of view of technical analysis, the trend on the GBP/USD currency pair on the hourly time frame is bullish. The price is correcting within the bullish trend, with a flat accumulation formed below the support level of 1.2665, which will now act as a strong support zone. The MACD indicator has turned positive again, but it should be noted that the divergence on the higher timeframes has not been filled, so the price may correct even lower. The fall may be down to the support levels around 1.2500. Selling can be sought intraday after the resistance level of 1.2712 or in case of stronger growth — from 1.2745, but with confirmation in the form of sellers’ initiative. Buying is best sought from the support level of 1.2665, but also with confirmation in the form of buyers’ initiative, as the price can easily sell this level.Alternative scenario: if the price breaks the support level of 1.2448 and consolidates below, the downtrend will likely resume. 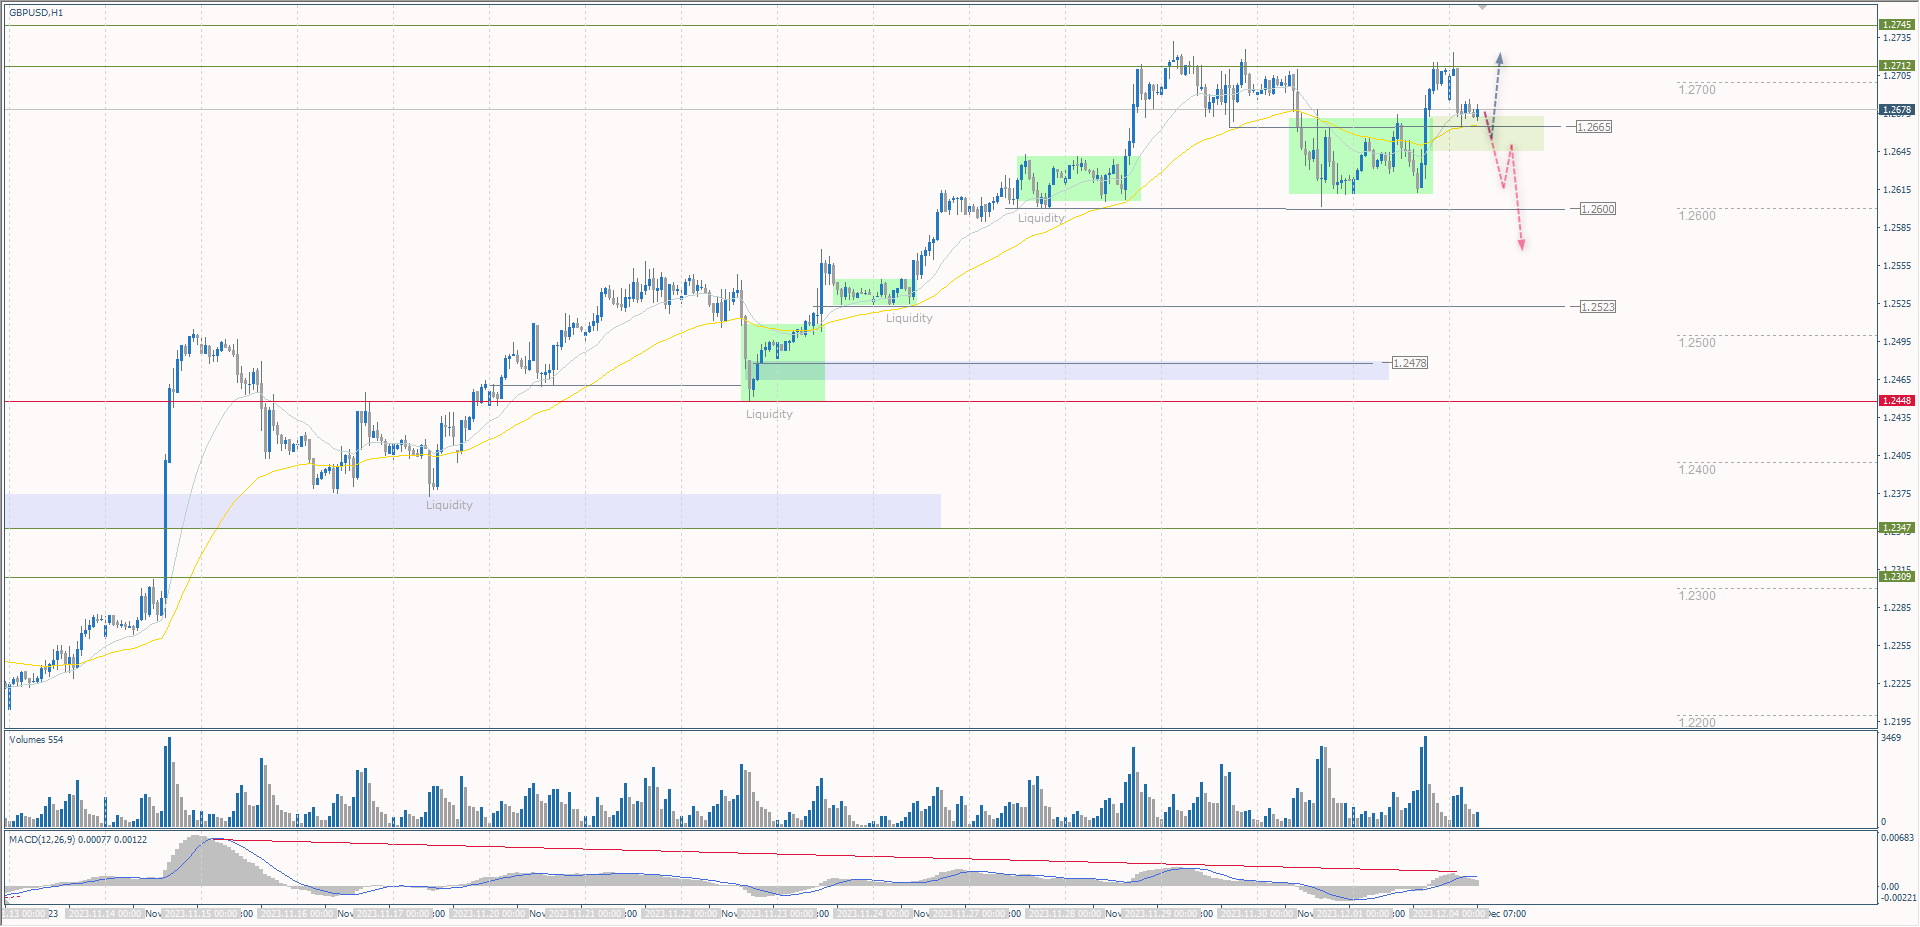 There is no news feed for today.
The USD/JPY currency pairTechnical indicators of the currency pair:
On Friday, the yen rose to a 2-month high against the dollar. Friday’s economic news was mostly better than expected and supported the yen. The Jibun Manufacturing PMI for November was revised upward by 0.2 to 48.3 from the previously released 48.1. In addition, the unemployment rate for October unexpectedly fell by 0.1% to 2.5%, indicating a stronger labor market compared to expectations of no change at 2.6%. Despite “dovish” statements of BoJ officials that the bank will not be in a hurry to abandon the super-soft policy, the yen continues to strengthen on investors’ expectations that in 2024, the processes towards normalization and tightening will begin.Trading recommendations
From the technical point of view, the medium-term trend on the currency pair USD/JPY is still bearish. The price failed to consolidate above 148.51, while above the resistance level of 147.79, a zone of false breakdown with “locked” liquidity of buyers was formed. The price is now trading below 146.74, with the MACD indicator indicating weak buying pressure. Under such market conditions, buying can be considered after an impulsive return above 146.71, but with confirmation with short targets. Selling is best considered from the 147.21 or 147.79 resistance level but with confirmation in the form of sellers’ reaction.Alternative scenario: if the price consolidates above the resistance level of 148.51, the uptrend will likely resume. 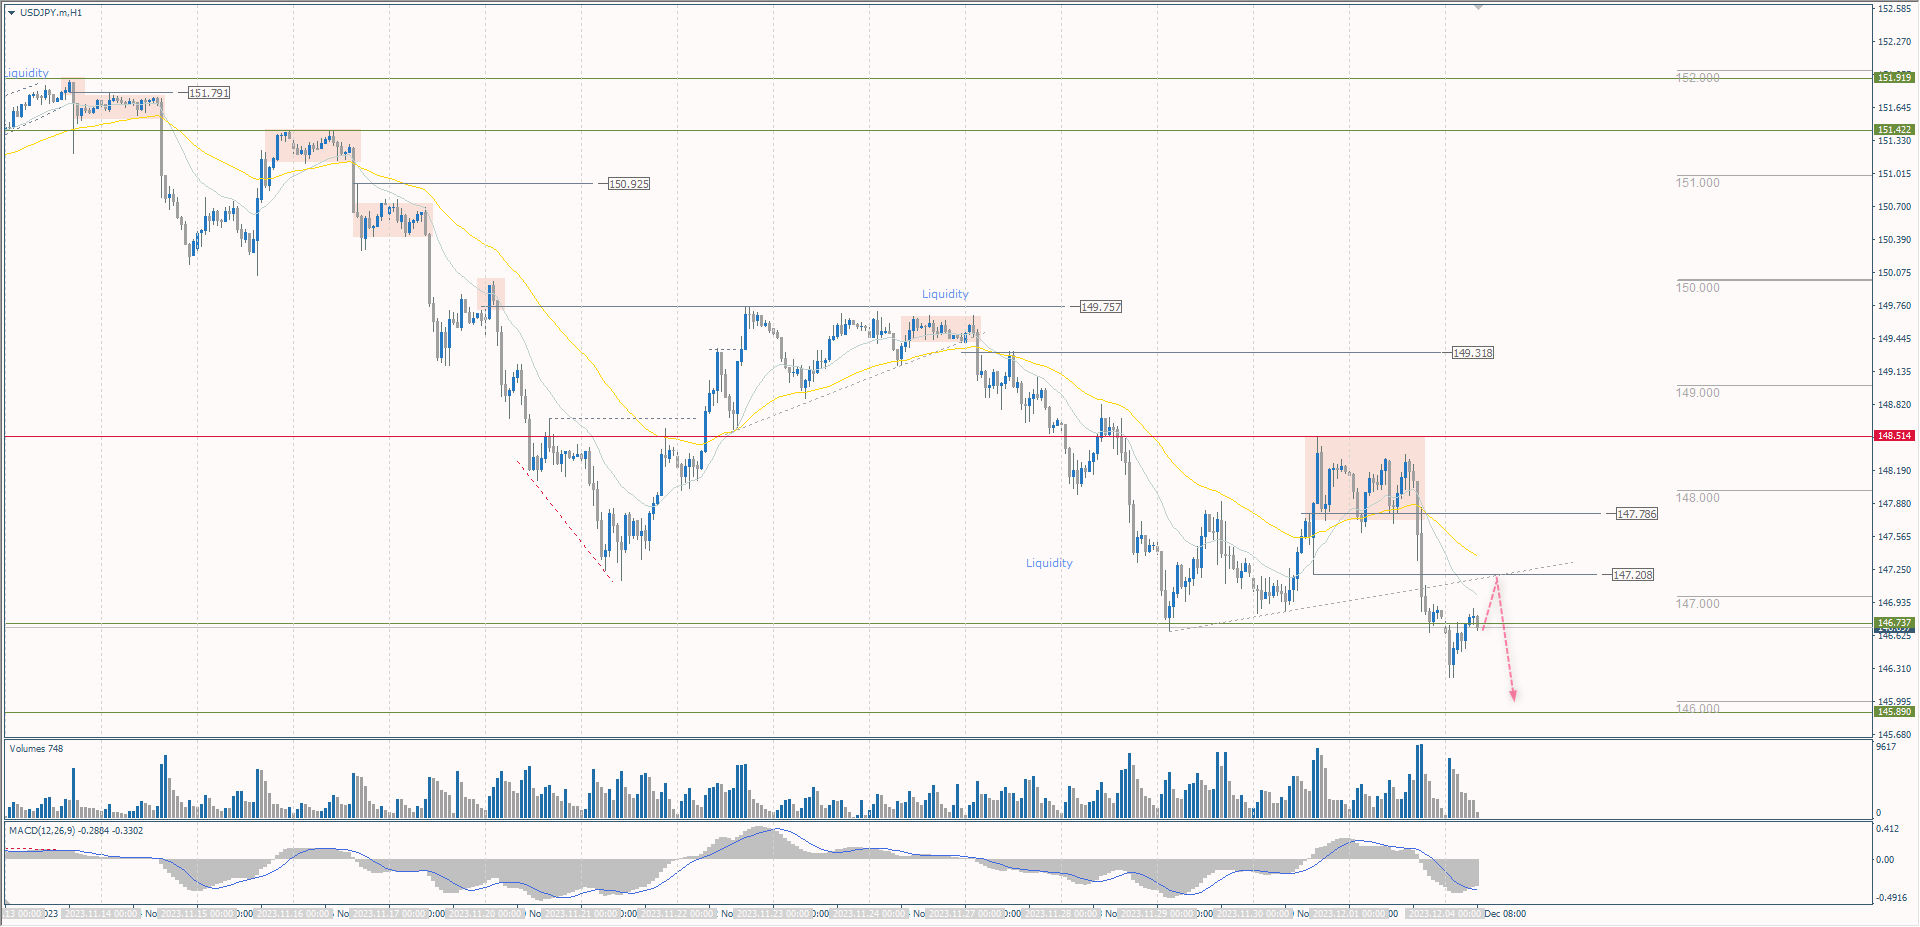 There is no news feed for today.
The XAU/USD currency pair (gold)Technical indicators of the currency pair:
The weakening of the dollar on Friday supported the prices of precious metals. Gold soared to a record high and silver to a 6-month-high. At the same time, metals continued their rise on Monday. In early trading on Monday, the precious metal rose more than 3%, surpassing the previous all-time high set on August 7, 2020. In gold’s favor is the fact that the tightening of monetary policy is coming to an end, and only lower rates should be expected ahead. This caused a sharp drop in the dollar and Treasury bond yields, which is a positive factor for gold, which does not generate interest income.Trading recommendations
From the point of view of technical analysis, the trend on the XAU/USD is bullish. At the opening of trading on Monday, gold hit an all-time high followed by a moderate sellers’ reaction. The MACD indicator turned positive and overbought, but there are no signs of divergence. The price pullback is because a huge number of buy positions were triggered above the historical highs, and now this liquidity needs to be taken to lower prices. Also, after updating the historic high, sellers have become active and are also selling, hoping for a deep pullback. But it is quite risky to sell now because gold can make another wave of growth to test the liquidity at the European or American session. Therefore, there are no optimal entry points for selling now. Buying can be considered from the support level of 2079 or 2065, which is near the moving averages.Alternative scenario: if the price breaks below the support level of 2031, the downtrend will likely resume. 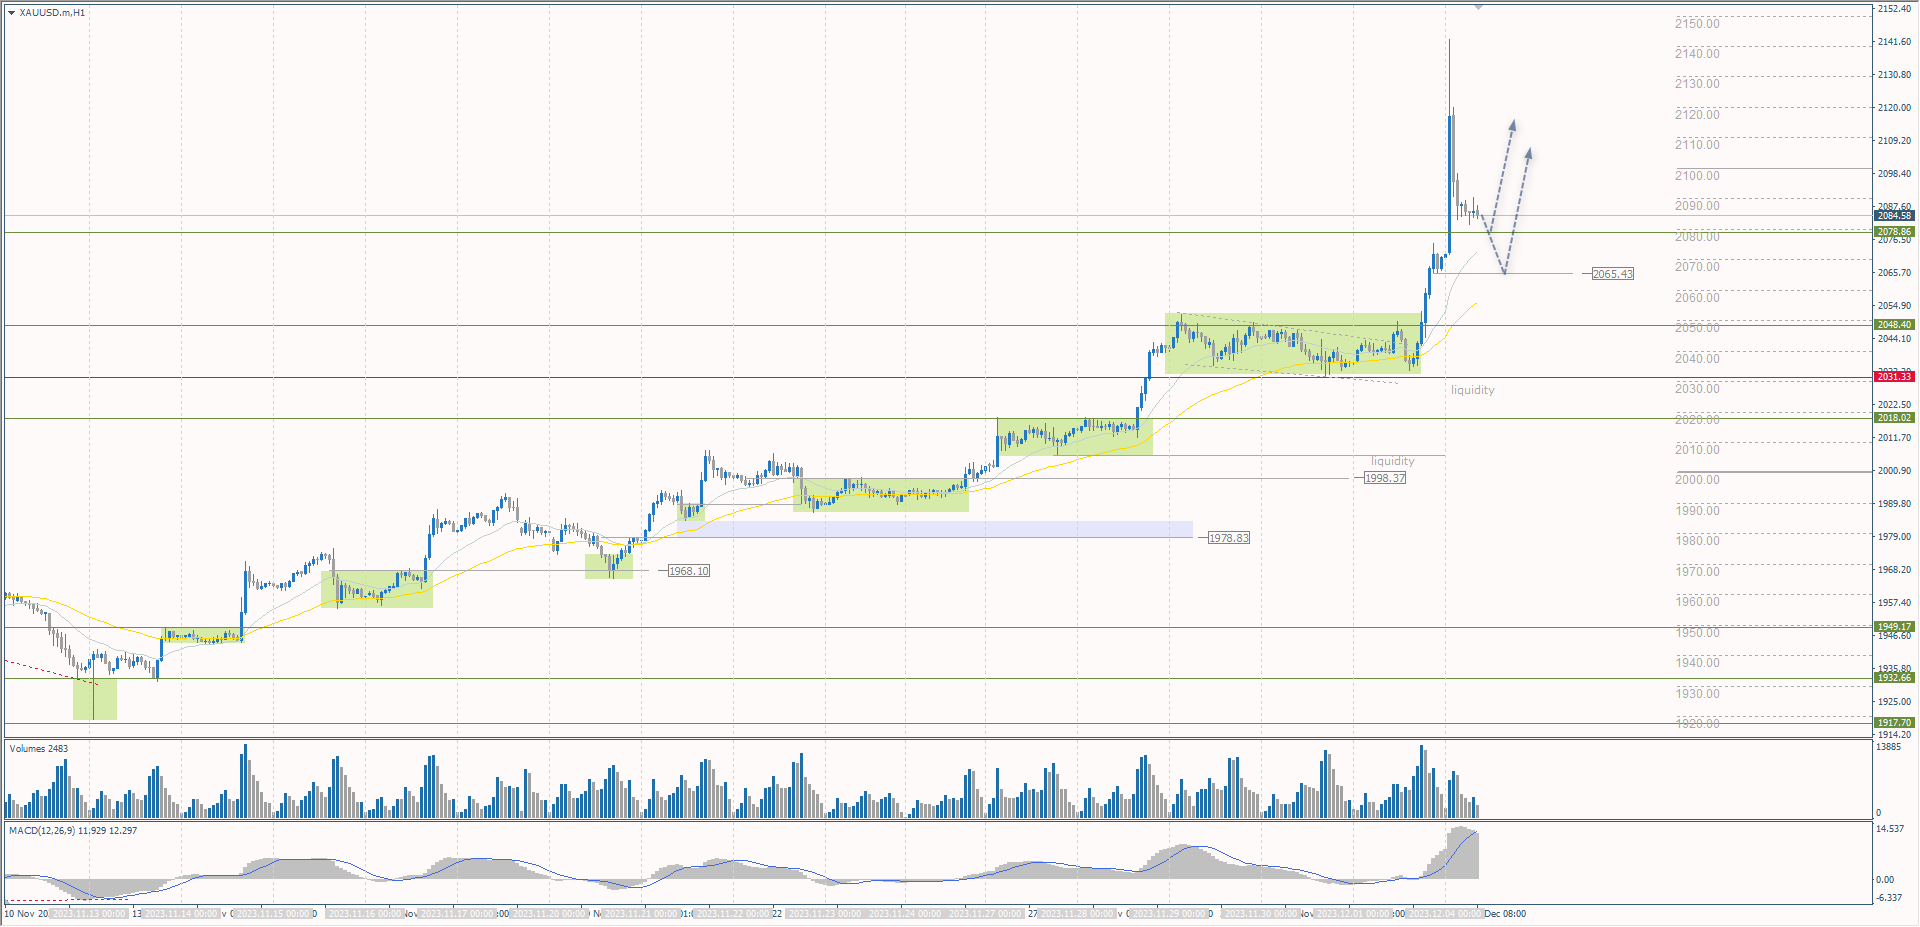 News feed for 2023.12.04:
More By This Author:Analytical Overview Of The Main Currency Pairs – Friday, Dec. 1
There Is Still Disagreement On Production Quotas Within OPEC+. Inflationary Pressures Are Easing In The Eurozone
Analytical Overview Of The Main Currency Pairs – Thursday, Nov. 30


Leave A Comment