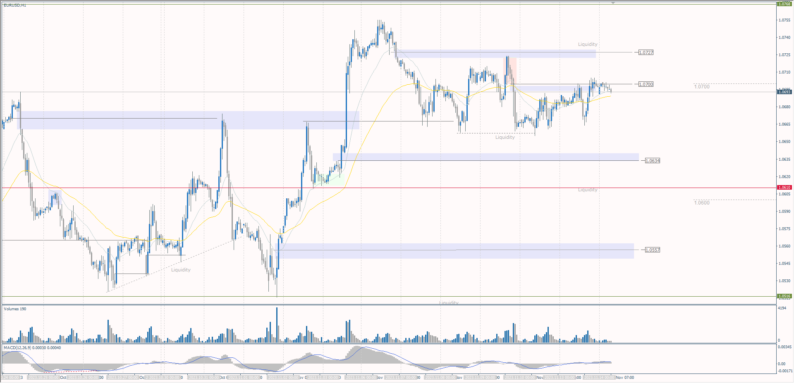
The EUR/USD currency pairTechnical indicators of the currency pair:
The October inflation report will be released today in the US. Economists expect core inflation (excluding food and energy prices) to remain unchanged at 4.1% y/y, while overall CPI is expected to decline from 3.7% to 3.3% y/y. A sharper weakening in inflation could lead to renewed talk of peak rate hikes, fueled by the October employment report, which pointed to weakening labor market conditions. For this reason, a fall in inflation is a negative for the dollar and a positive for the euro.Trading recommendations
The trend on the EUR/USD currency pair on the hourly time frame is bullish. At the moment, the price is forming a flat accumulation at the level of moving averages. The MACD indicator has become inactive. Buying can be sought from the support levels at 1.0634. Falling below 1.0634 is undesirable as it will start to change sentiment, and then the uptrend will be jeopardized. Sell deals should be considered after testing the resistance level of 1.0700, but with confirmation in the form of sellers’ reaction.Alternative scenario: if the price breaks the support level of 1.0610 and consolidates below it, the downtrend will likely resume. 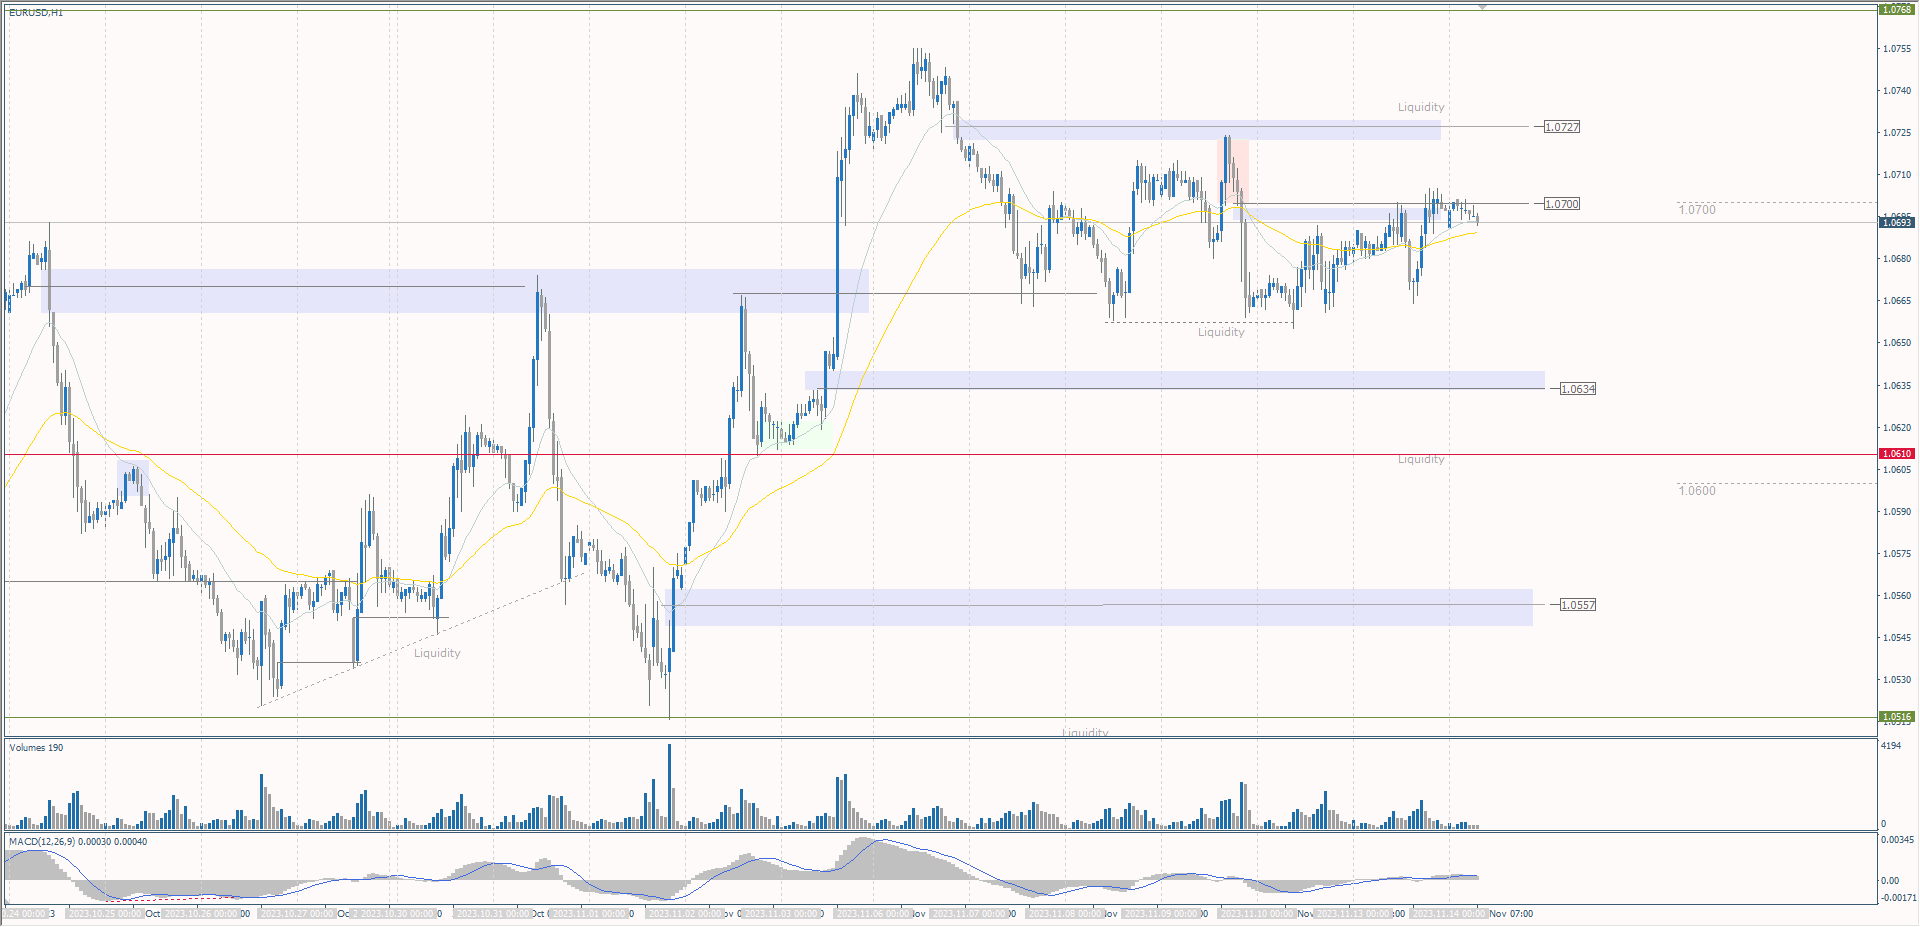 News feed for 2023.11.14:
The GBP/USD currency pairTechnical indicators of the currency pair:
According to HSBC, one of the largest UK banks, the Bank of England will keep interest rates unchanged until 2025. Strong wage growth in the UK will ensure that inflation remains uncomfortably high for Bank of England policymakers tasked with bringing inflation back to the 2.0% target. HSBC notes that while inflation has fallen, it looks set to remain high and could still be well above the levels seen in many other major European countries, forcing the Bank to maintain a wait-and-see stance throughout next year. UK labor market data will be released today, and the inflation report will be released tomorrow.Trading recommendations
From the point of view of technical analysis, the trend on the GBP/USD currency pair on the hourly time frame is bullish. On Friday, the price corrected to support at 1.2199, where buyers showed their interest. At the moment, the price has reached the resistance level of 1.2270, but the reaction of sellers is weak, which increases the probability of testing liquidity above 1.2311. The MACD indicator remains positive, but the bullish momentum has weakened. Buying should be sought from the support level of 1.2199 but with confirmation intraday. Sell trades can be sought after the sellers’ reaction at 1.2268 or after liquidity testing above 1.2311 with the sellers’ reaction.Alternative scenario: if the price breaks the support level of 1.2156 and consolidates below, with a high probability the downtrend will resume.  News feed for 2023.11.14:
The USD/JPY currency pairTechnical indicators of the currency pair:
The yen remained under pressure on Monday and reached a new 1-year low against the dollar. Fears that the Bank of Japan will maintain QE and negative interest rates pressured the yen after news came out on Monday that October producer prices in Japan were weaker than expected. October machine tool orders fell for the tenth consecutive month. The Bank of Japan can’t be happy with the recent decline in the yen, which has fallen by 1.45% against the US dollar in the past week alone. According to analysts, if the yen breaks through the 152 mark, the threat of intervention from Tokyo will become even more likely.Trading recommendations
From the technical point of view, the medium-term trend on the currency pair USD/JPY is bullish. Yesterday, the price reached the resistance at 151.91, followed by a sharp reaction of sellers, with a false breakout zone formed above 151.70, which will now act as resistance. Under such market conditions, traders can look for sell trades from 151.79 with a target of 151.05. Buy trades are best considered after a pullback, as the price is strongly technically overbought on many technical indicators.Alternative scenario: if the price consolidates below the support level at 149.83, the downtrend will likely resume.  There is no news feed for today. The XAU/USD currency pair (gold)Technical indicators of the currency pair:Precious metals prices recovered from early losses on Monday and showed moderate gains. The weakening dollar on Monday was a bullish factor for metals. A decline in global bond yields also supported the metals. Today, the US inflation report for October will be published, where price pressure is expected to weaken, which may prompt the Fed to abandon further tightening of monetary policy. For gold, this could be a good trigger for growth.Trading recommendationsFrom the point of view of technical analysis, the trend on the XAU/USD is bearish. Yesterday, the support level of 1933 prevented the price from going lower, with the buyers showing initiative. At the moment, the price is trading at the level of moving averages, and the MACD indicator has become positive. Under such market conditions, buying can be considered intraday from the support level of 1940, but with confirmation in the form of buyers’ reactions. For selling, traders can consider the resistance level of 1955 but with confirmation in the form of sellers’ reaction as the price may try to test liquidity above 1965.Alternative scenario: if the price breaks above the resistance level of 1971, the uptrend will likely resume.
 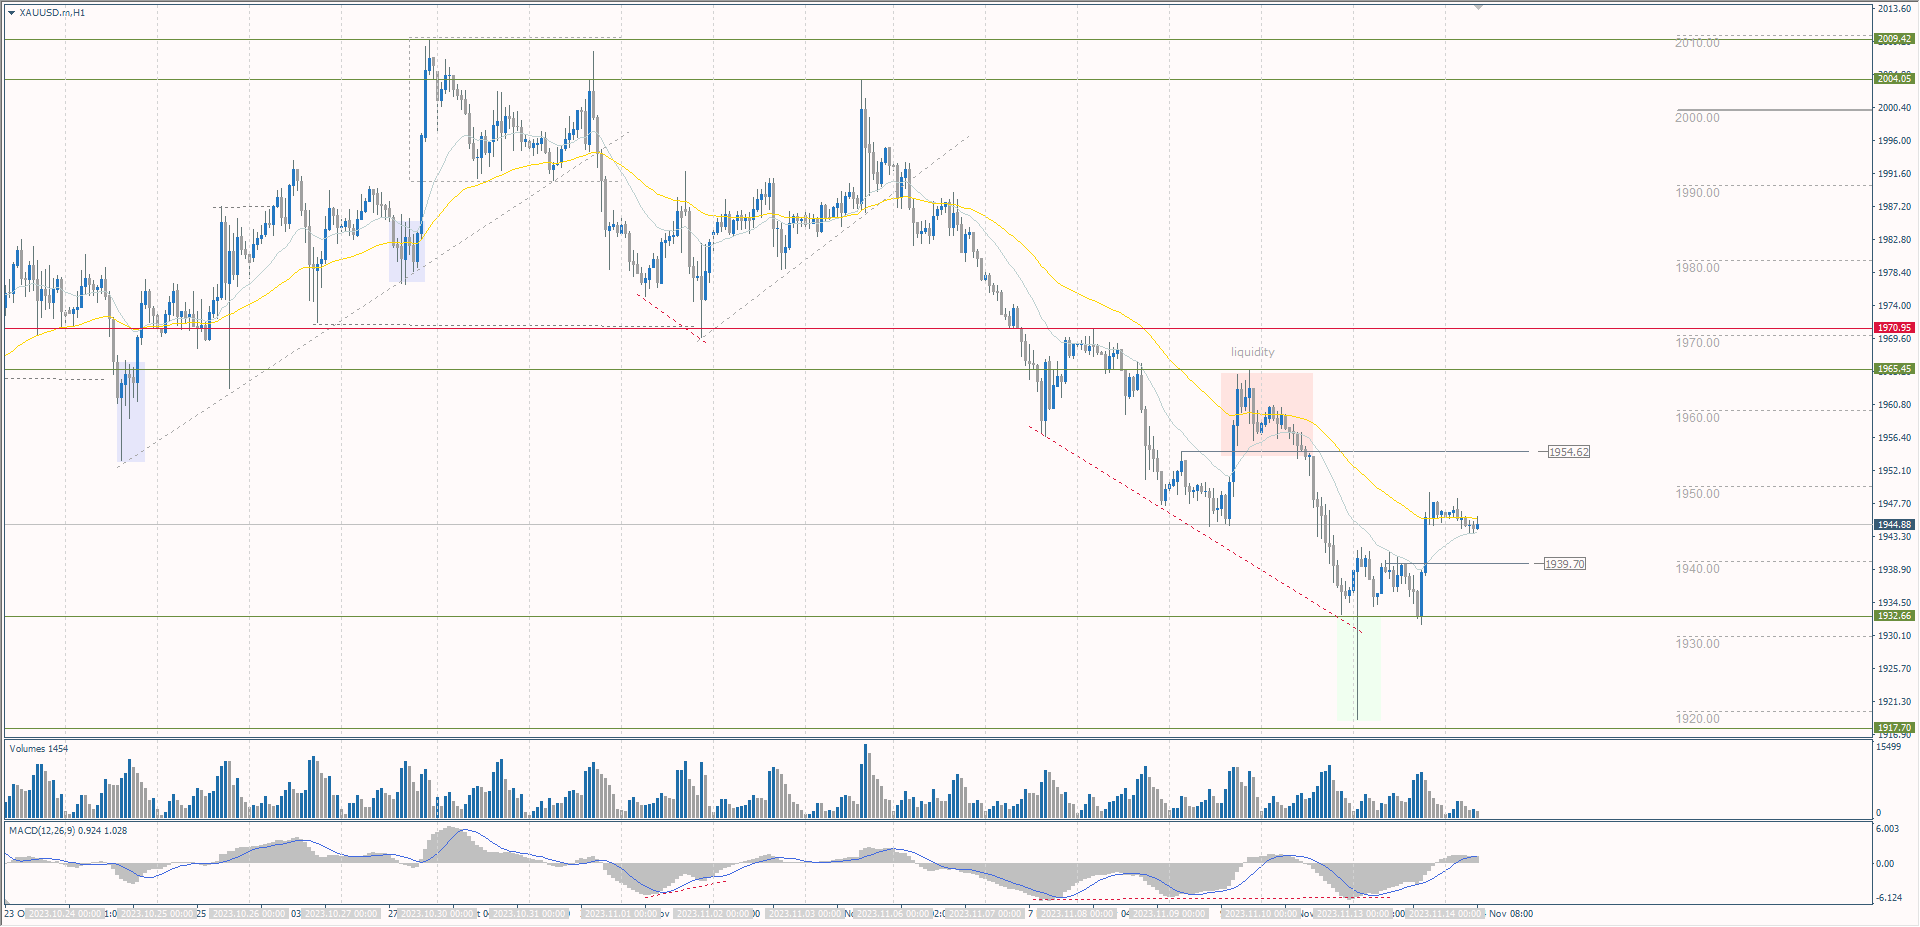 News feed for 2023.11.14:
More By This Author:Analytical Overview Of The Main Currency Pairs US Stock Indices Reached 2-month Highs. The Earning Season Met Investors’ Expectations Recovery Conditions Are Forming For Oil


Leave A Comment