Factoring investing (intro here) is one of the hottest topics in investing today and one that we have studied and written about extensively. The promise is outperformance at low cost. Massive amounts of capital market data across stocks, bonds, commodities, currencies and other assets has been mined to show that rules such as “buy cheap stocks” (value) or “buy past winners” (momentum) have delivered risk-adjusted outperformance over time. There is now a so-called “zoo” of factors, most of which are not underpinned by a structural or behavioral reason why they should deliver positive returns in the future. In fact, many factors have already been discredited through out-of-sample tests and real-world experience. Even for the most tried and tested factors, like Value and Momentum, returns do not come easily as they can go through long periods of underperformance (10+ years). This is no different than owning a single asset class like stocks or bonds.
We aim to answer two questions in this thought piece:
If factor returns can be expected to be better than those of asset classes and are more diversifying, then investors should hold a lot of exposure to these sources of return. If, on the other hand, factor returns are no better than asset classes, on a risk-adjusted basis, and also highly correlated, then they are at best substitutes for asset class exposure. If this were the case, one could simply leverage up the similar asset class, with lower complexity, and achieve the same portfolio effect as owning the factor exposure. In this article, we will explore these questions, specifically focused on the equity factors of Value, Momentum, Quality and Low Volatility.
Factors have delivered similar risk-adjusted performance as asset classes
Factor risk-adjusted returns similar to asset classes
All sources of return come with risk. Asset classes, like stocks and bonds, deliver a return in exchange for taking risk. Over time, they have delivered excess returns over cash in approximately 60% of annual periods. This translates into Sharpe ratios of around 0.3. Should factor strategies be better? The few fundamentally sound factors, like Value and Momentum, are based on behavioral biases, structural constraints, or risk transfers. There should be compensation over the long-term for assuming these risks. At the same time, factor strategies are quantitative, rules-based and transparent. This makes them relatively easy to implement, though not as reliably as buying and holding an asset class. We know that anything that is easily copied in investing should not produce exceptional risk-adjusted returns since markets are competitive and zero sum. Therefore, it is logical that, at best, factor strategies should deliver similar risk-adjusted returns as asset classes.
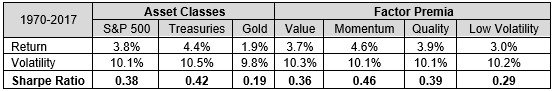
We use factor return histories from the Ken French data library to empirically show factor performance beside asset classes. Different methods for constructing factor portfolios will show slightly different results but we think this dataset is representative for the most common strategies. The table below summarizes the historical returns of 3 asset classes with histories back to 1970 beside the performance of the 4 most popular equity factors – Value, Momentum, Quality, and Low Volatility. All returns have been adjusted to 10% volatility. We can see that the factors delivered similar Sharpe ratios (risk-adjusted return) as the asset classes, mostly in a range from 0.3-0.4.

Source: Ken French Data Library, Bloomberg, Greenline Partners analysis. The results are hypothetical results and are NOT an indicator of future results and do NOT represent returns that any investor actually attained. Indexes are unmanaged, do not reflect management or trading fees, and one cannot invest directly in an index.
The risk with factors is that their results will be materially worse than the historical data show due to potential crowding. Some have discussed why this is not the case. We think the lack of consistency of factor returns, as we will show below, is enough to keep from crowding out returns entirely. But we also think it is only prudent and reasonable to expect the return premium from these strategies to be lower going forward as billions of dollars are now “exploiting” them.
Factor drawdowns similar to those of asset classes
Another way to show similar risk-adjusted performance of factors and asset classes is by looking at their historical drawdowns. The chart below compares the S&P 500 to the Value premium (both adjusted to 10% volatility). We can see both suffer 30+% drawdowns. This same pattern is true for all factors and asset classes and is characteristic of a return stream with a Sharpe ratio around 0.3.
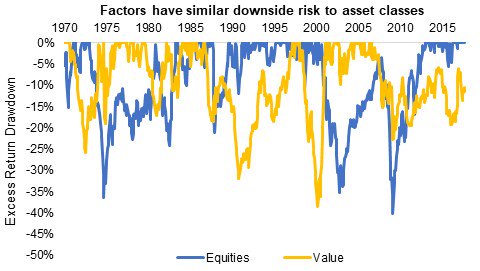
Source: Ken French Data Library, Bloomberg, Greenline Partners analysis. Data from Jan 1970-Sept 2017. The results are hypothetical results and are NOT an indicator of future results and do NOT represent returns that any investor actually attained. Indexes are unmanaged, do not reflect management or trading fees, and one cannot invest directly in an index.
In addition to drawdowns, we look at longer periods. All factors can go through many years of consecutive underperformance, just like asset classes. Below we compare the rolling 10-year returns of equities and the Value premium. We can see that both return streams have experienced multiple 10+ year periods without earning a return. Most investors are well aware of the lost decade for the S&P 500 from 2000-2009. Investors are less aware of the lost decade for Value from 2008-present as we can see from the yellow line.


Leave A Comment