Several articles from a variety of sources recently caught my eye. The common thread of these articles was that return factors—those that have shown a propensity to outperform the market over time—have been losing their ability to outperform.
Most of these articles posit that as factors have gained in prominence in financial circles, the potential for future outperformance has been arbitraged away. Since so much money has been funneled into smart beta exchange-traded funds (ETFs) aimed at exploiting these exact factors, less of an edge will exist going forward. A bold claim, to be sure, but does the data back it up?
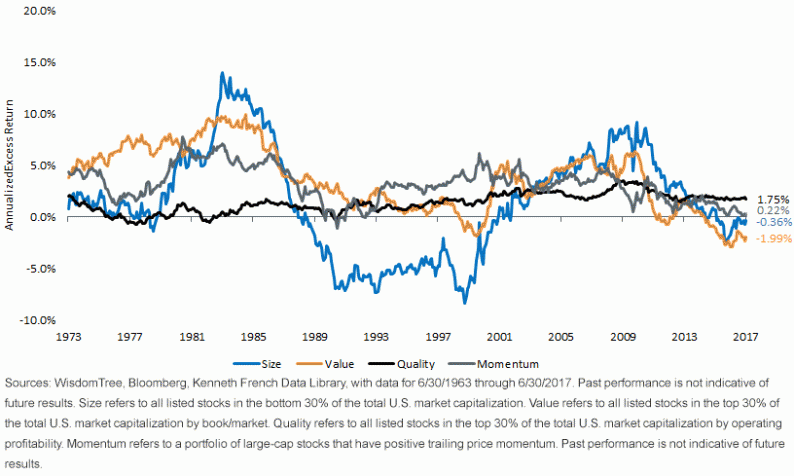
Using data from Professor Kenneth French’s website, we can isolate several U.S. equity factors and compare them to the market’s returns. We took the four most oft-cited factors—size, value, quality and momentum—and analyzed them over rolling 10-year periods to view the effectiveness of these factors over the entirety of market cycles. Has there been a drop-off in performance in recent years?
Rolling 10-Year Annualized Excess Return vs. S&P 500
Reduced Outperformance, but Not Eliminated Outperformance
Looking at the data, a few takeaways emerge:


Leave A Comment