
Earlier this month I profiled the US stock market’s performance in search of context for deciding if recent returns have gone off the deep end. The results suggest that on a rolling 10-year basis, the numbers look middling. Next question: how does the S&P 500 stack up after adjusting for risk via several metrics?
Let’s start by looking at the Sharpe Ratio (SR), Sortino Ratio (SORT), and Adjusted Sharpe Ratio (A-SR) via annualized calculations. A brief summary of each:
Sharpe Ratio: a performance metric that adjusts returns based on volatility.
Sortino Ratio: similar to the Sharpe ratio except that this metric only penalizes volatility associated with negative returns whereas SR treats all volatility equally.
Adjusted Sharpe Ratio: a variation of the standard Sharpe ratio that adjusts for skewness and kurtosis by penalizing returns for negative skewness and excess kurtosis. The metric was outlined in Pezier and White (2006).
For this simple review I used monthly S&P 500 returns published by Professor Robert Shiller. The start date for this test is 1900. Note, too, that the risk-free rate hasn’t been subtracted from the performance data, i.e., the results are based on S&P returns rather than risk premia. The main takeaway: the market’s current risk-adjusted performance still looks average, based on a rolling 10-year window.
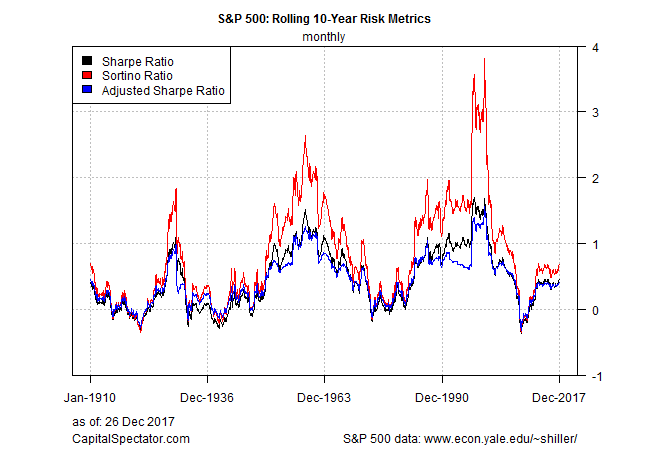
In all three cases, the risk-adjusted performance metrics currently rank as modestly above their respective median results relative to the historical record for the past 100-plus years. The current 10-year Sharpe ratio, for instance, is 0.46 vs. the median 0.38. The current Sortino ratio: 0.68 vs. the 0.60 median. The Adjusted Sharpe Ratio is currently 0.40 vs. a median of 0.38. Here are the historical results at the quartiles:
Sharpe Ratio Sortino Ratio Adjusted Sharpe Ratio
0% -0.37 -0.36 -0.32
25% 0.07 0.22 0.15
50% 0.38 0.60 0.38
75% 0.84 1.35 0.69
100% 1.70 3.81 1.56


Leave A Comment