
<< Read More: Are Recent S&P 500 Returns Excessive Relative To History? – Part I
<< Read More: Are Recent S&P 500 Returns Excessive? – Part II
<< Read More: Are Recent S&P 500 Returns Excessive? – Part III
In today’s final installment1 of evaluating the US stock market’s recent performance, the toolkit uses three alternative risk metrics: the Sterling Ratio, the Calmar Ratio, and the Omega Ratio. In the dark art of deciding if the current return is extreme or not, I crunched the numbers using two rolling periods: 5 years and 20 years. Depending on which window you favor, the market’s current performance looks middling or flying in the upper reaches relative to the historical record.
Before we look at the results, here’s a brief definition of the three ratios:
Calmar Ratio: the ratio of annualized return over the absolute value of the maximum drawdown. The higher the ratio, the stronger the risk-adjusted performance.
Sterling Ratio: The Sterling ratio is identical to the Calmar Ratio except that it adds an excess risk measure to the maximum drawdown, in this case 10%.
Omega Ratio: an estimate of the probability of earning a minimum or higher return, in this case defined as 0%. The higher the ratio, the more likely that the minimum return or higher will be achieved.
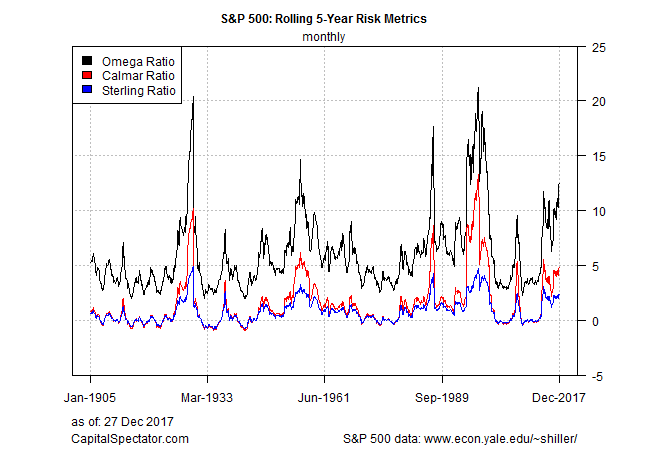
The first chart shows the results for the S&P 500 on a rolling 5-year window. The main takeaway: the market’s current return is relatively elevated in risk-adjusted terms. All three metrics are in their respective top quartile, based on data for the last 100-plus years.
Risk-adjusted returns look moderate, however, when we shift to a 20-year rolling window. For this time period, all three metrics currently score at slightly below their respective median value in the context of the historical record since 1920.

The obvious question: Which time period carries more weight for deciding if recent market performance is extreme? Unclear. Mr. Market neglected to write a rule book for assessing equity valuations. But all’s not lost. A partial solution is using your investment time horizon as a guidepost. For example, if you’re planning on withdrawing from a US equity portfolio (or liquidating it entirely) in five years or less, you should be wary of recent market action and act accordingly. If you can sit tight for 20 years or more, by contrast, the latest returns appear less precarious, based on the risk metrics in the second chart above.


Leave A Comment