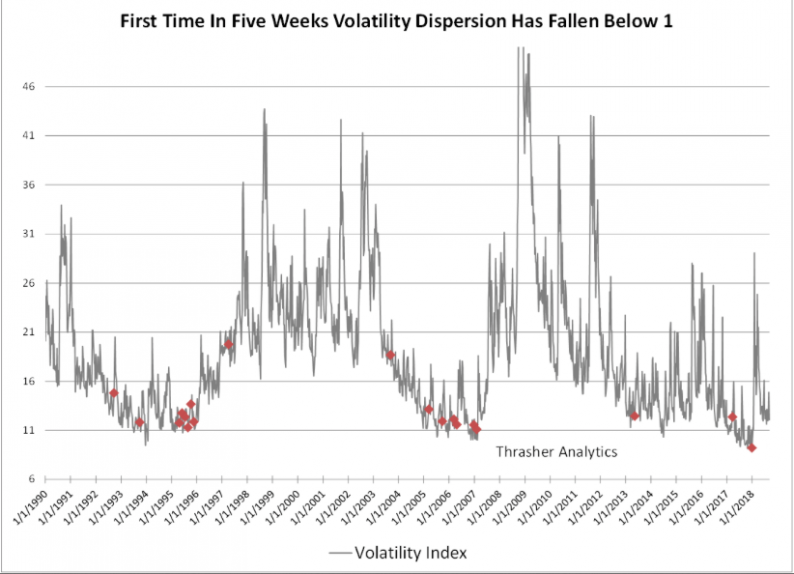
The markets have been expressing strong sector rotations since the spring months and post the February-March correction period. There has been little correlation in the market since the spring, which is also proving an obstacle for driving fear into the market, as measured by the VIX, despite the many geopolitical risks that have arisen. As it was in 2017 and in early 2018, the lack of fear and increased sector rotations produce great market dispersion. We can see this visually in the following VIX chart from Thrasher Analytics:
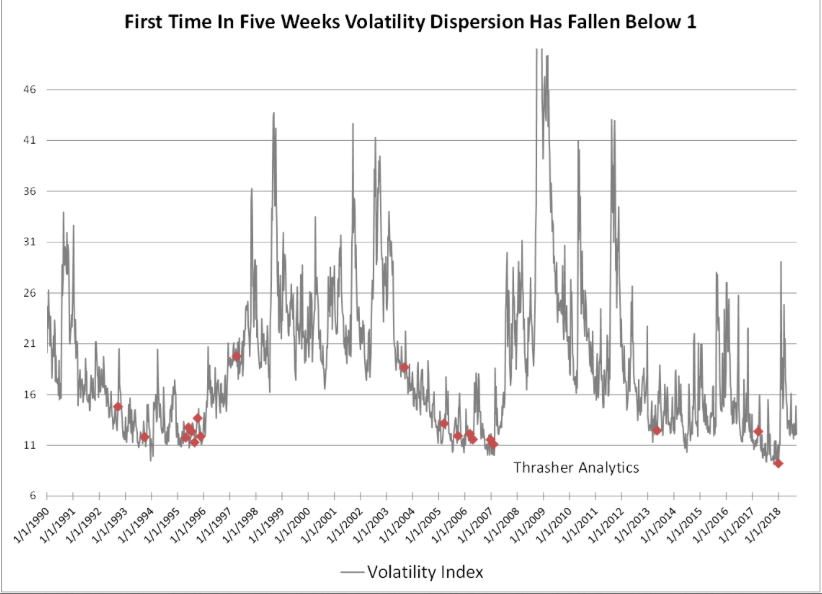
“The chart above shows when the weekly dispersion of the VIX has fallen below 1 for the first time in five weeks, a level that as of today we’re very close to breaking under. What immediately stands out to me is that this narrowing in weekly dispersion was one of the early warning signs before the massive spike in February. That’s not to say we will see a repeat of the February spike, but it does lend itself to the idea that complacency has flooded the volatility market as it did earlier this year. Before January, we didn’t see weekly dispersion narrow like this outside of 2017 and 2013 and before then we’d have to go back to 2007 when the VIX put in an ultimate low before the GFC.”
More so than any other volatility indicator, the VIX weekly dispersion indicator has proven an effective warning signal, when coupled with other metrics that include SKEW Index and VVIX readings. At present, both SKEW and VVIX are not expressing a warning signal that aligns with VIX weekly dispersion, but on any given day both can explode as is the case for most aspects of the VIX complex.
What’s most important to recognize from the subject matter is that adverse/negative reactions from the VIX complex are most exaggerated from “newness” and when markets better correlate. The VIX complex of indicators and readings often overreact to new fears or fears that have not been raised for long periods of time. Wage inflation fears from the January Nonfarm Payrolls report was a fear that hadn’t been contemplated for some time and when the metric came in much hotter than anticipated, dispersion gave way to correlation, the VIX rose dramatically and equity indexes fell in unison. When equity markets, sectors and/or indexes begin to reconnect or better correlate, the VIX and equity markets can move dramatically more than expected. As is always the case, volatility traders should store this in their resource bank for future use.


Leave A Comment