The Australian dollar rocked and rolled on Australia’s change at the helm, with Morrison taking over and also at Trump’s action. Here are the highlights of the week and an updated technical analysis for AUD/USD.
Australia was rocked by political turmoil. After a turbulent week, Scott Morrison ousted Malcolm Turnbull as Prime Minister. Fears of the ascent of Peter Dutton weighed on the Aussie. In the US, Trump’s former confidant Michael Cohen, turned against him. In addition, Trump criticized the Fed for raising rates. The FOMC Minutes clarified that the Fed will raise rates in September but Powell’s speech already had a different tune. Powell does not see an overheating economy nor accelerating inflation. The AUD/USD recovered as the week drew to an end.
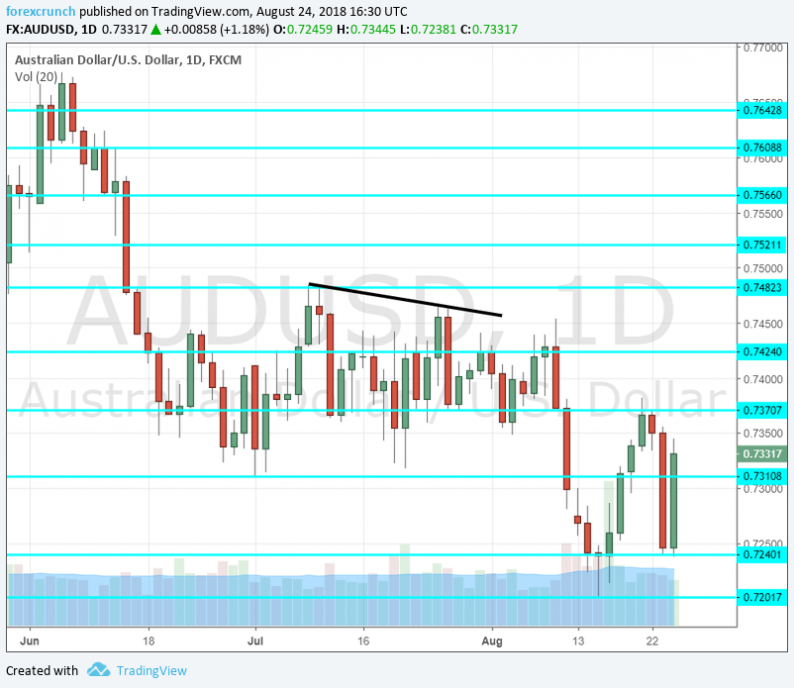
AUD/USD daily graph with support and resistance lines on it. Click to enlarge:

*All times are GMT
AUD/USD Technical Analysis
Aussie/USD made sharp moves up and down, eventually recapturing the 0.73 handle.
Technical lines from top to bottom:
0.7560 is the next level to watch after it was the recovery level in early May. 0.7520 was a swing low in late May.
0.7480 capped the pair in mid-July and defends the round 0.75 level. 0.7420 capped the pair twice in mid-July. 0.7360 was a low point in mid-July.
0.7310 is the low of July 2018. 0.7240 was a swing low in late August and serves as a support.


Leave A Comment