
AUD/USD reversed directions last week and dropped 100 points. The pair closed at 0.7584. It’s a light week, with only three events on the calendar. Here is an outlook on the major market-movers and an updated technical analysis for AUD/USD.
There were no surprises from the RBA, which kept the benchmark rate at 1.50%. Australian Retail Sales softened to 0.6%, but still beat expectations. In the US, the Federal Reserve minutes pointed to division over the timing of the balance sheet reduction and concerns about low inflation.
Updates:
AUD/USD daily graph with support and resistance lines on it. Click to enlarge:
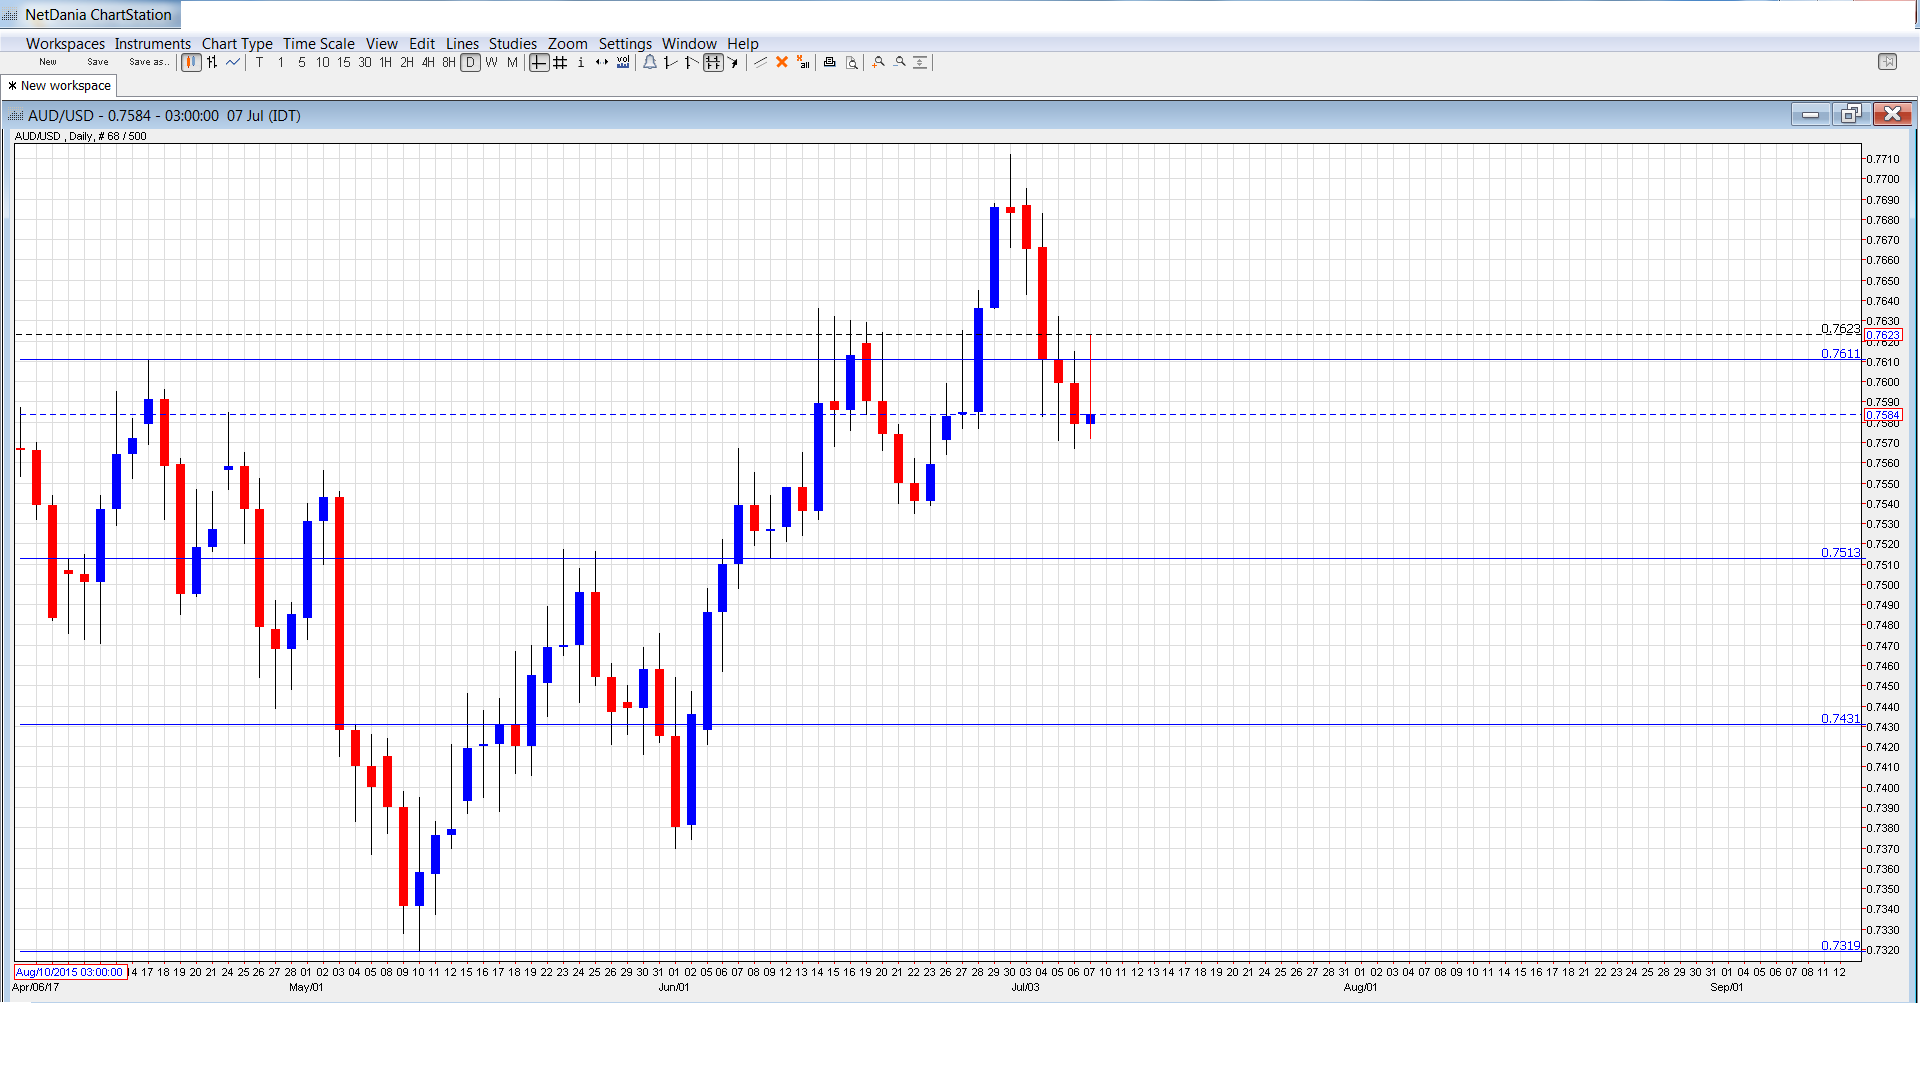
AUD/USD Technical Analysis
AUD/USD opened the week at 0.7687 and quickly touched a high of 0.7695. It was all downhill from their, as the pair reversed directions and dropped to a low of 0.7567, as support held firm at 0.7513 (discussed last week). The pair closed the week at 0.7584.
Live chart of AUD/USD:
Technical lines from top to bottom:
We start with resistance at 0.7938.
0.7835 was the high point in April 2016.
0.7749 has been a resistance line since March.
0.7611 has switched a resistance role after sharp losses by AUD/USD. It is a weak line
0.7513 is an immediate support line.
0.7429 is next.
0.7319 has been a cushion since early May.


Leave A Comment