
AUD/USD recovery targeting key resistance pivot at 7336– broader risk higher while above 7239
The Australian Dollar has rallied nearly 2% off the fresh yearly lows registered last week with the advance taking price into a critical pivot zone we’ve been tracking for months now at 7327/363. Here are the updated targets and invalidation levels that matter on the AUD/USD charts into the open of the week.
AUD/USD DAILY PRICE CHART
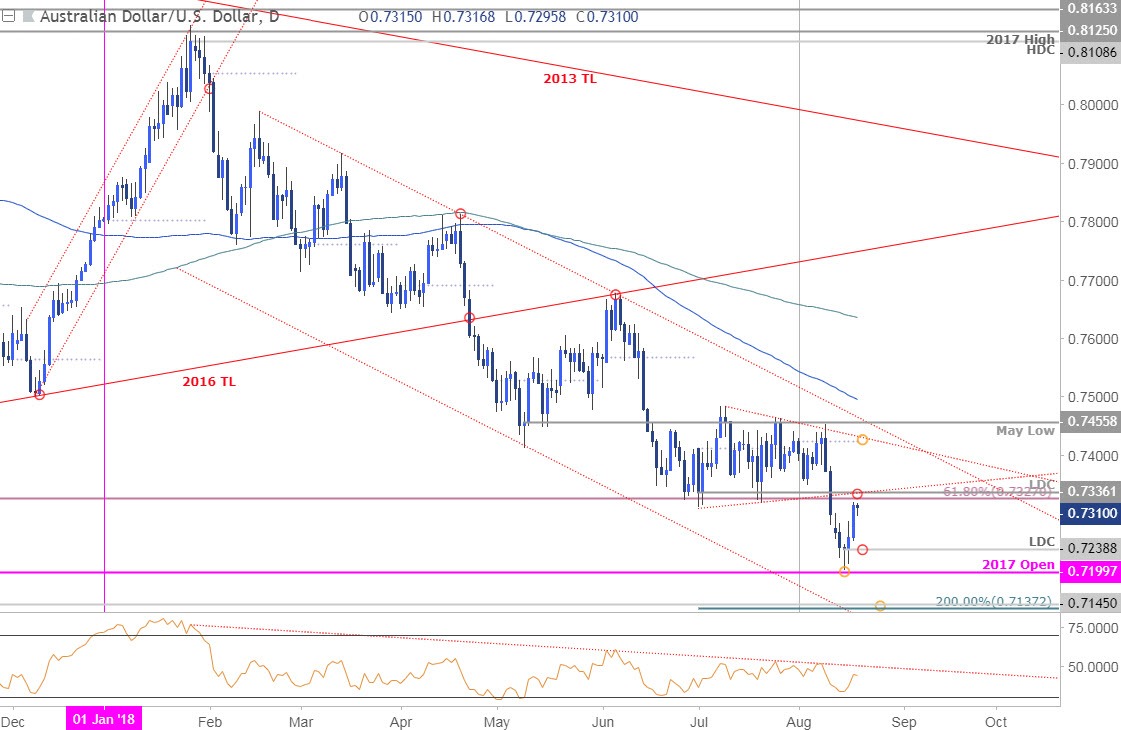
Technical Outlook: Earlier this month we highlighted a key focus range in AUD/USD between 7327-7505; price broke the bottom of this zone with conviction on August 10th with the decline taking out support targets at 7298 and 7230 before turning just pips from the 2017 open at 7200.
The Aussie reversal is now targeting former key support, now resistance, at 7327/36 where the July low-day close and 61.8% retracement of the 2016 advance converge on former slope support. This is the first major resistance hurdle for this rebound and a breach / close above would be needed to suggest a more significant low is in place.
AUD/USD 240MIN PRICE CHART
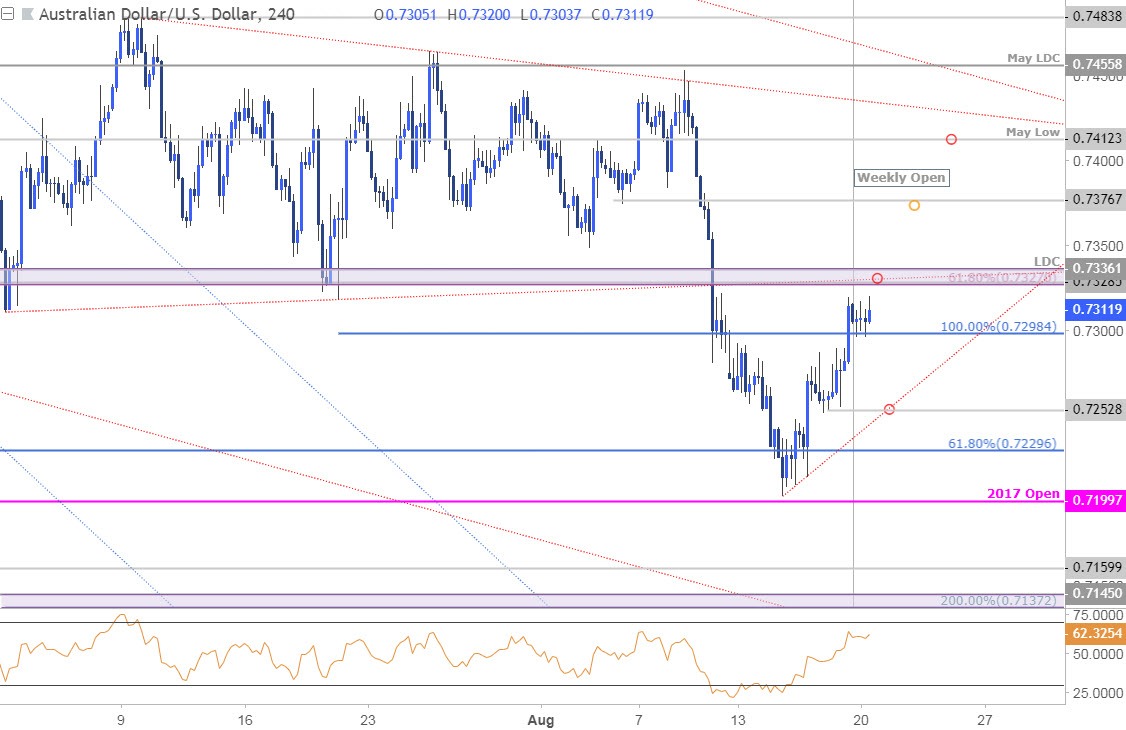
Notes: A closer look at Aussie price action sees the pair opening the week just below this key resistance threshold. Interim support rests at 7298 backed by 7253 with our near-term bullish invalidation level at the yearly low-day close at 7239. A topside breach here targets 7376 backed by the May lows / August open at 7412/24(note July slope resistance just higher).
Bottom line: Looking for a reaction on a stretch into the 7327/36 pivot zone with a breach / close above needed to fuel the next leg higher in Aussie. From a trading standpoint, I’m looking for near-term exhaustion on a move higher here but ultimately, a larger pullback may offer better entries for the recovery higher.


Leave A Comment