
In this series, we scale-back and take a look at the broader technical picture to gain a bit more perspective on where we are in trend. The Australian Dollar is testing yearly slope resistance on the heels of the RBA decision with the US Midterm Election results and the FOMC interest rate decision on tap. Here are the key targets & invalidation levels that matter on the AUD/USD weekly chart.
AUD/USD WEEKLY PRICE CHART
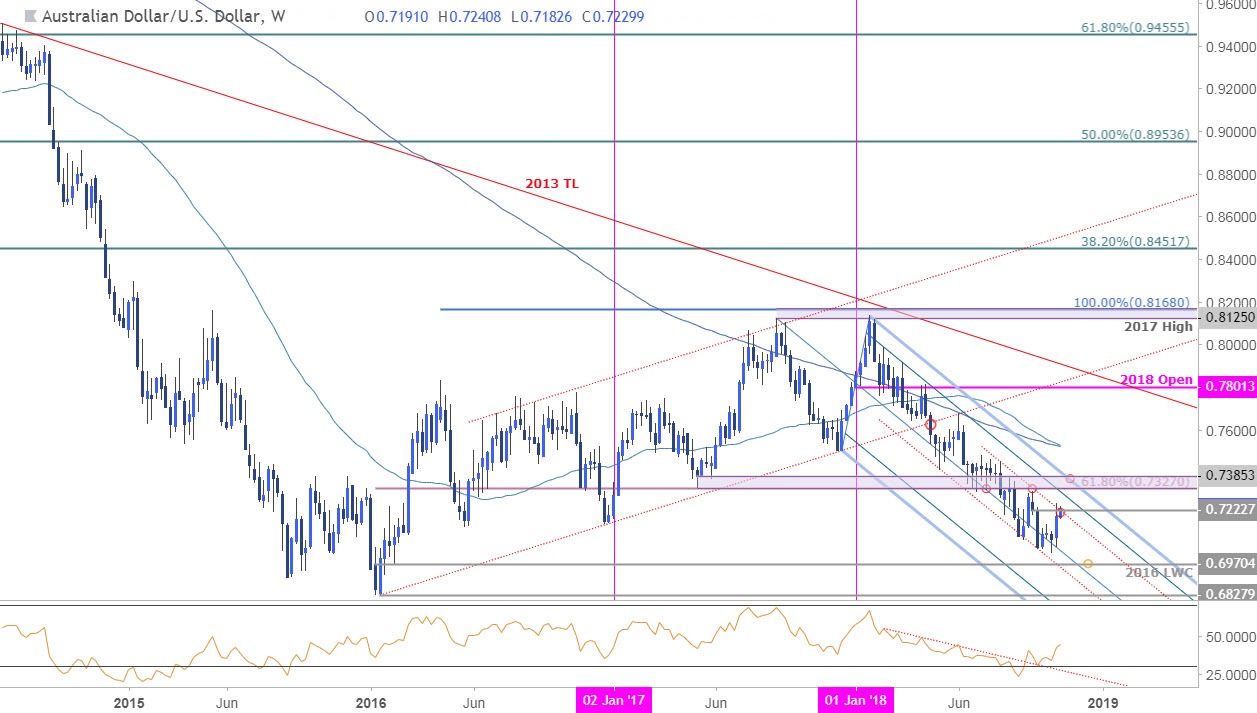
Notes: Aussie has been trading within the confines of a descending pitchfork formation extending off the 2017 & 2018 highs with prices with price rebounding off a sliding parallel (red) extending off the May lows late-last month. The subsequent rebound takes AUD/USD into a parallel that has governed price since the August highs and we’re looking for a reaction here.
Initial resistance stands at the September high-week reversal close at 7223– a topside breach / close above this threshold would look to challenge 7327 where the 75% line of the slope converges on the 61.8% retracement of the 2016 advance. Ultimately a breach above the May low-week close at 7385 would be needed to suggest a more significant low is in place. Interim support rests at the median-line with a break below the 2016 low-week close at 6970 needed to mark the resumption of the broader downtrend, targeting the 2016 lows at 6828.
Bottom line: AUD/USD is testing weekly down-slope resistance here on the heels of the RBA. The immediate advance is vulnerable below this threshold but IF Aussie has turned, losses should be limited to the yearly low-week close at 7087. From a trading standpoint, I’ll favor fading weakness while above this threshold with a breach of the parallel (red) needed to fuel the next leg high in the Australian Dollar. I’ll publish an updated AUD/USD Scalp Report once we get further clarity on near-term price action.


Leave A Comment