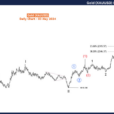

On Friday, 8 April 2016 Bank of America Corporation (BAC) was trading at $13.09 on the New York Stock Exchange. The stock has a 52-week trading range of $10.99 on the low end and $18.48 on the high-end. At current prices, the company is valued at $135.22 billion. BACs price earnings ratio is 9.98 and its earnings per share is 1.31. According to analysts, the 1-year target estimate price is $17.41. For the year to date, Bank of America’s share price has declined by 22.10%. While this is substantial, and worrisome, it is in line with the performance of the financial sector as a whole on Wall Street.
In Q4 2015, BAC generated surprisingly positive earnings. The earnings per share amounted to $0.28, which was above analysts’ forecasts of $0.27. In Q4 2014, BAC generated earnings per share of $0.25. For the full fiscal year last year, BAC earnings-per-share was reported at $1.31, three times greater than the $0.36 for 2014. Other important financial data from 2015 includes the following:

What are Analysts Saying about Bank of America Corporation?
According to data provided by Thomson/First Call, Bank of America Corporation has a mean recommendation of 1.8. On a rating scale of 1.0 (strong buy) to 5.0 (strong sell), the stock is clearly bullish. Additionally, it has a mean target price which is over $4 higher than the current trading price. The high price target is $20 per share and the low price target is almost $2 higher than the current price. This indicates that Bank of America stock is undervalued, which makes sense given the battering that the financial sector has taken in 2016. The performance of Bank of America becomes more interesting when we take technical factors into account. The 5-day, 20-day, 50-day, 100-day and 200-day performance figures are all negative. This is evident in the technical analysis summary provided below:


Leave A Comment