US equity bears had an excellent opportunity to push prices lower. Indices did come under pressure. But it looks like once again bulls managed to put their foot down on time.

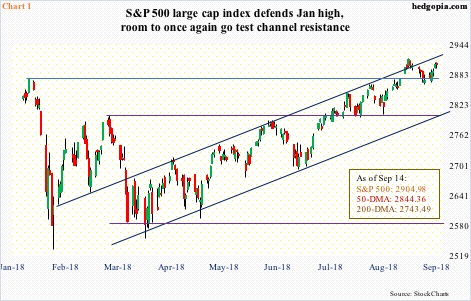
The S&P 500 large cap index made a new all-time high of 2916.50 on August 29, before coming under pressure. By then, it had rallied 9.1 percent for the year. Conditions were overbought on nearly all timeframe. Investor sentiment was elevated. This was an opening for the bears, and they took it. Through September 7 intraday, the index fell 1.8 percent. And that was it. Bulls essentially defended the high from late January when the S&P 500 fell for a quick, double-digit decline after peaking at 2872.87 on the 26th (Chart 1). The 20-day moving average was tested several times last week and the week before, and it held.
Medium- to long-term, there are still risks. On momentum indicators such as the RSI, divergence is developing. Near term, however, bulls have improved their chances. When the S&P 500 (2904.98) retreated 13 sessions ago, it did so after facing resistance at a seven-month channel. If it goes on to test the upper bound, it has room to rally to a new high.
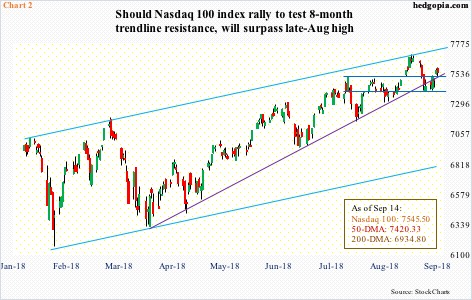
Over on the Nasdaq 100 index, after peaking at 7691.10 on August 30, it quickly shed 3.8 percent intraday in the next five sessions. Short-term support at 7500 was gone. Briefly, a rising trend line from early April was lost as well (Chart 2). But the bulls were not willing to let go of the 50-day. In the past two and a half months, this was a third test of the average. The first two resulted in successful defense, eventually resulting in a new high. This time around, the index hovered around the average for five sessions before rallying off of it last Thursday. Shorter-term averages have been recaptured.
Since peaking late January, the Nasdaq 100 (7545.5) has consistently made higher highs and higher lows. The upper bound currently extends to 7750, which is what longs are probably eyeing near term.


Leave A Comment