
The US reports January CPI figures tomorrow. The market seems especially sensitive to it. The main narrative is that it is an inflation scare spurred by the jump in January average hourly earnings that pushed yields higher and unhinged the stock market.
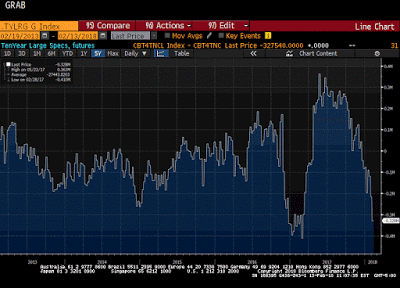
This Great Graphic comes from Bloomberg and is derived from data issued by the Commodity Futures Trading Commission (CFTC). When trading futures, one must declare whether one has an underlying business interest (commercial) or not (non-commercial). Non-commercial participants are speculators.
This chart shows the net position, which is a combination of gross longs and gross shorts. The chart shows that the net speculative short position is approaching the record high seen in Q1 17. A year ago, some keen observers were warning that the bearish view was excessive, but this year, some of the same observers are warning of even higher yields ahead.
Yet, if anything, the net position conceals an extreme gross position. Specifically, as of last Tuesday, 6 February, the large speculators had a record gross short 10-year Treasury futures position. It stood at 939k contracts. The previous record from a year ago was 882k.The fact that the net position is not at a record means that the gross long position is greater than it was a year ago.
As of last Tuesday, the large speculators had a gross long position of 612k contracts.A year ago, it was around 470k contracts. The speculative gross long position peaked last May just shy of 950k contracts, which is roughly the size of the gross short position now.
In January 2017, the CPI rose 0.5% on the month. The January 2018 CPI is expected to have risen by 0.3%. This is why despite the rise in prices, the year-over-year pace is expected to slow to 1.9% from 2.1%.It would be the first reading below 2.0% since last August.


Leave A Comment