Economic Reports
Economic Growth & Investment
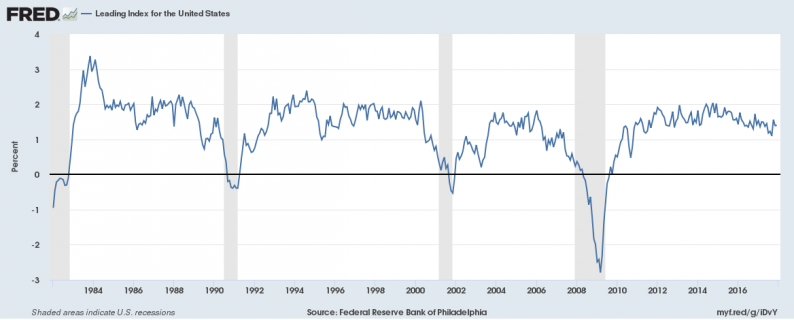
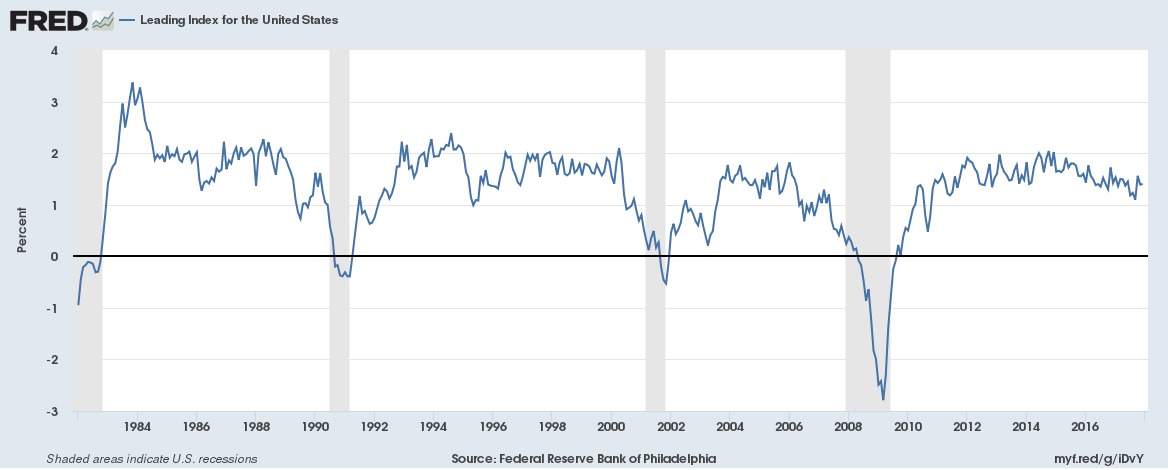
We pay particular attention to broad-based indicators of growth. The Chicago Fed National Activity Index and the Conference Board’s Leading Economic Indicators are examples. We watch them because we are mostly interested in identifying inflection points in the broad economy and aren’t as interested in the details. Why? Because, while bear markets do happen outside of recession, it is rare and unpredictable. Our best chance of acting in advance of a bear market is to identify the onset of recession. And concentrating on the details of the economic data can cloud one’s judgment about the overall economy which is what matters to the market as a whole.
But we also think you have to be careful in interpreting these indexes. You don’t want to overreact to noise or not react to a real warning. So it is interesting, in the case of the LEI, to see what factors are moving the index. The most recent release showed a rise of 1% in the LEI, quite a bit stronger than expected. But what drove the rise? Building permits, stock prices, and ISM new orders, none of which, by themselves, are very informative about future growth. All of them are, to some degree, measures of sentiment rather than actual hard data about the economy. Building permits are not a commitment to actually build anything even if they do show intent. Stock prices, as the old Wall Street saying goes, have predicted nine of the last five recessions. And the ISM report has been showing robust growth for over a year that quite simply refuses to show up in the hard manufacturing data. So don’t get too excited about the LEI; it isn’t as strong as it appears.
And no, the positive ISM and regional Fed sentiment still hasn’t found its way into the industrial production report, down 0.1% in January with the manufacturing part of the report flat. December was revised down significantly as well. One can’t help but wonder if the Trump administration’s honeymoon period is about over; sentiment works for a while but at some point, the growth has to actually show up.
One recent big bright spot was the Quarterly Services survey which showed an 8% rise in information services spending. That’s a huge improvement over last quarter which was up just 1.1%.
Production
The Empire State and Philly Fed surveys were both positive but both also showed rising price pressures. There seems little ability to pass along higher costs to consumers at this point so if costs continue to rise it will likely be reflected in profit margins.
Consumption
Retail sales disappointed, down 0.3% in January with December revised lower as well. Autos were quite weak likely a reflection of the end of the Hurricane Harvey surge. Building materials were also down 2.4% which also may reflect the end of the hurricane rebuilding. The slowdown also hit e-commerce retail sales but only in the growth rate, down to 3.2% from 3.5% the previous quarter. Year over year growth rate is still near 17% so no reason to panic but online sales may be starting to mature a bit.


Leave A Comment