As a picture is worth a 1000 words, we let the chart speak.
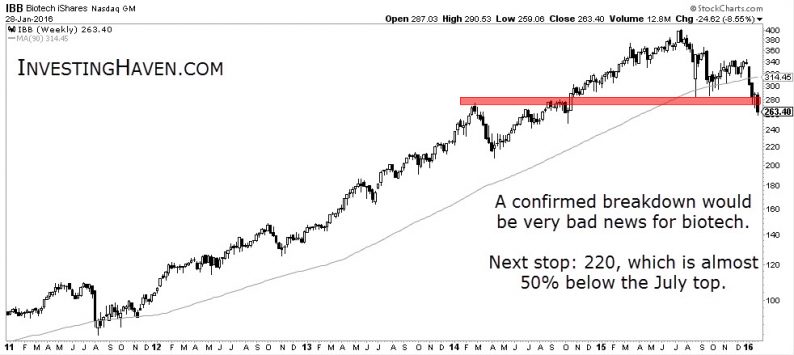
Biotechnology peaked last July. The IBB ETF, representing the sector, has dropped from around 400 points to 263 (last close) in a bit more than half a year. That is a drop of some 34%.
The problem right now is that biotech is breaking through major support, indicated in red on the chart. If that support level does not hold (a very likely scenario), then we see the next support level between 200 and 220 points, which would mark a decline of almost 50%. We aren’t there yet, but the chart really looks scary. This not the time to take positions; it is a time to be patient and let the market do its work.


Leave A Comment