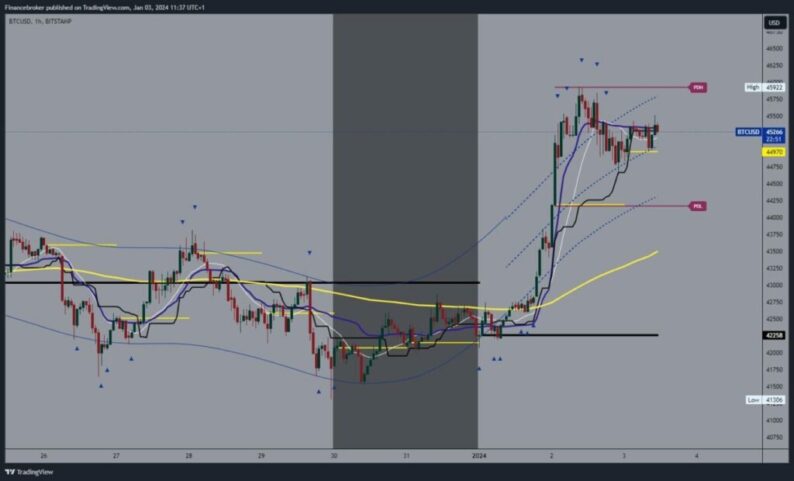
Bitcoin chart analysisThe price of Bitcoin continues the bullish trend at the beginning of this year. On Monday, we saw the price cross above the EMA50 moving average and strong bullish consolidation from the $42500 to $45922 level. There we encounter resistance and make a pullback to support at the $44650 level. After that, the price is consolidated and in the $45,000-$45,500 range. There is a good chance of seeing a breakout above and visiting the previous resistance zone. Potential higher targets are $45750 and $46000 levels.We need a pullback below the $45000 level for a bearish option. This would allow us to test yesterday’s support. The price would be under more pressure to start a further pullback and form a new low. Potential lower targets are $44500 and $44250 levels.  Ethereum chart analysisEthereum’s price climbed back above $2400 yesterday, forming this week’s high at the $2433 level. There, we encounter resistance and start with a bearish consolidation to support at the $2340 level. Then we return above $2350 and continue moving in the $2350-$2380 range. Today, we encounter resistance at $2380 and fail to move above.We need a new impulse that would do that, and after that, we would easily start further recovery. Potential higher targets are $2400 and $2420 levels. We need a negative consolidation and a drop in Ethereum price below the $2350 level for a bearish option. This would be considered negative for the price and its further recovery. Potential lower targets are $2330 and $2320 levels. We will have additional support in the zone around $2320 in the EMA50 moving average.
 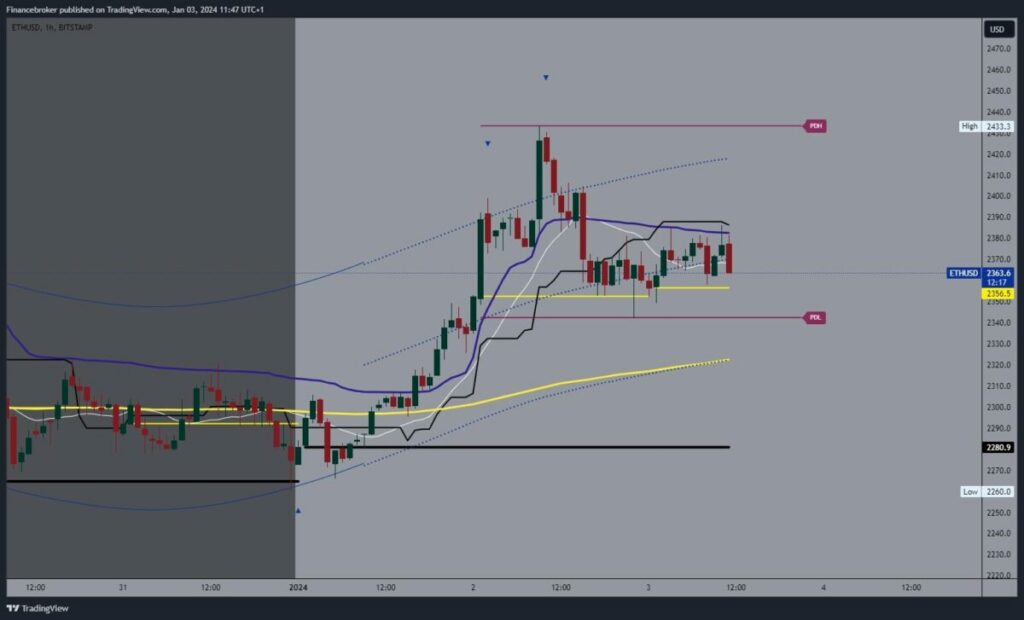 More By This Author:Oil and natural gas: Oil is retreating below $70.00Forex Markets 2024: A New Era Of Global Trade DynamicsThe Year Of Forex Opportunities 2024: What To Watch


Leave A Comment