
Bitcoin chart analysisOn Friday, we saw a jump in the price of Bitcoin to the $38437 level. We stayed up there for a short time, and a pullback to the $37800 support level followed. On Saturday, the price managed to maintain at that level, and on Sunday we saw a breakthrough below and the formation of a low price at the $37,180 level. In that zone, we find support in the EMA50 moving average and see a stop to the fall in the price of Bitcoin.A breakout of the ispdo price could increase bearish pressure on the price and send it to test support at lower levels. Potential lower targets are the $37,000 and $36,800 levels. We need a positive consolidation and a move above the $37600 level for a bullish option. Then, we need to hold there and form the next bottom above that level. After that, we can expect to see a new bullish impulse and the start of a Bitcoin price recovery. Potential higher targets are $37800 and $38000 levels. 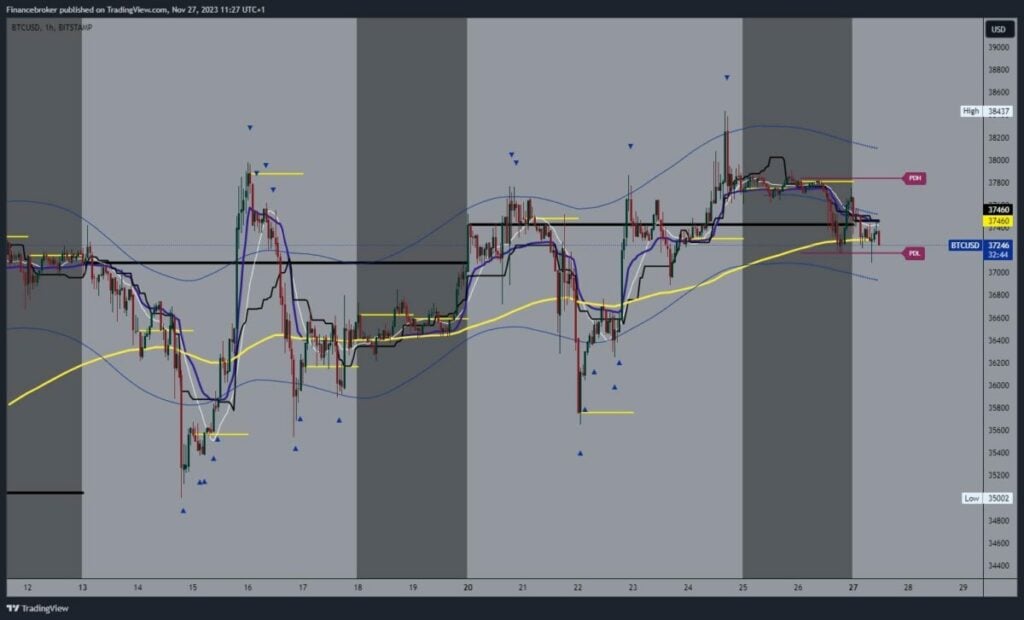 Ethereum chart analysisThe price of Ethereum is in retreat after climbing to the $2133 level on Friday. The weekend passed in a bearish consolidation with the $2040 level. There, we met the EMA50 moving average and started to recover, this time only up to the $2080 level. After that, a new pullback succeeded and a break below the EMA50 and the $2040 support level. We now expect to see a further decline and the formation of a new weekly price low.Potential lower targets are $2020 and $2000 levels. We need a positive consolidation and return above the $2040 level for a bullish option. Then we would have to hold above it and form a new bottom there. After that, we can expect to see a bullish impulse and the initiation of a bearish option. Potential higher targets are $2060 and $2080 levels.
 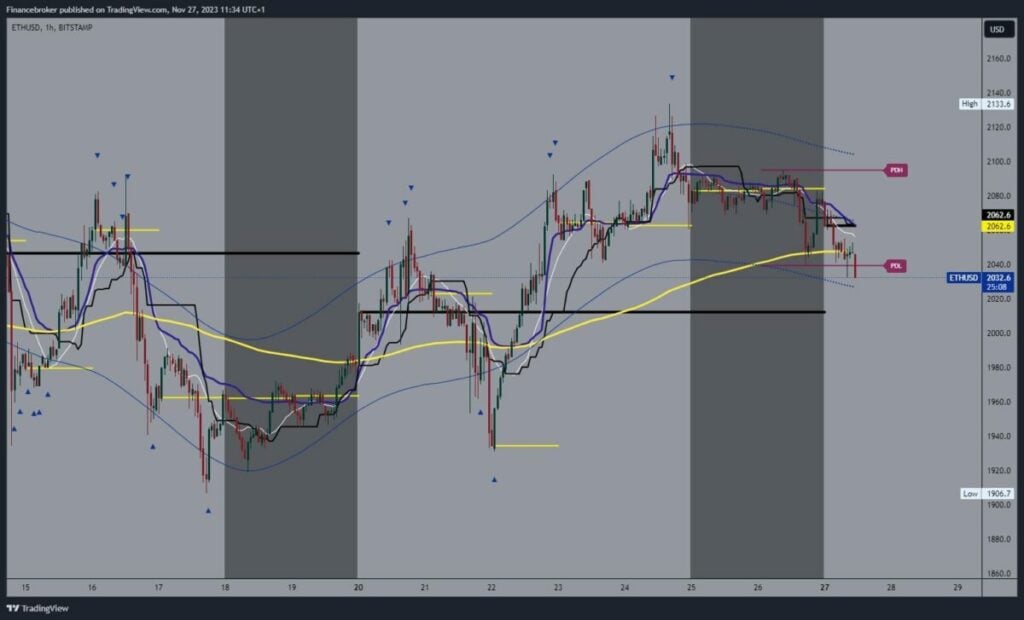 More By This Author:Oil Falls Below $75.00, While Natural Gas Slips Below $2.75
Russia Economy News: Lifted Summer Diesel Ban
Buy Side Liquidity And Sell Side Liquidity – Explained


Leave A Comment