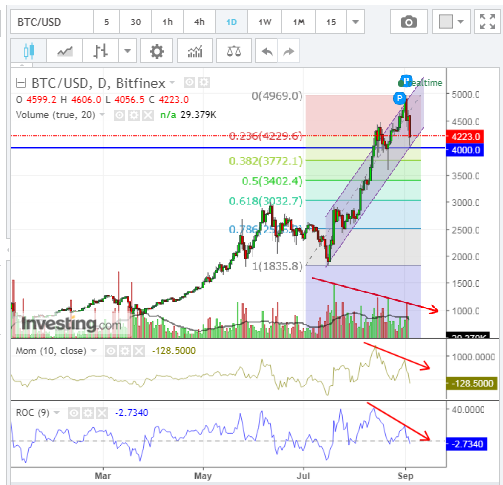
The following Daily chart of Bitcoin shows that the momentum and rate of change technical indicators are fading and do not support the latest push upwards to nearly 5000 (actual high was 4969).
Near-term support sits somewhere between 3770 (40% Fib retracement level) and 4000 (price and channel support).
Medium-term support sits around the 50% Fib retracement level of 3400, while longer-term support sits around the 60% Fib retracement level of 3000, which takes it almost to the bottom of the massive 2134-point August candle, as shown on the Monthly chart below.


Leave A Comment